注解
Click here 下载完整的示例代码
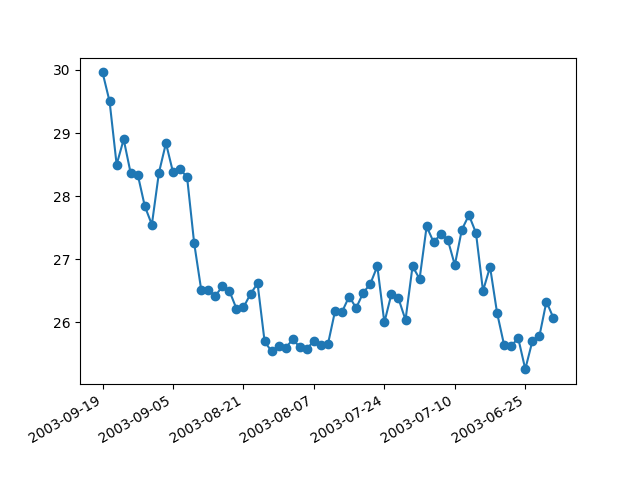
日期索引格式化程序
在绘制每日数据时,一个常见的请求是绘制数据,忽略跳跃,例如周末没有额外的空间。这在金融时间序列中尤其常见,当您可能有M-F而不是SAT、Sun的数据时,您不希望X轴出现间隙。方法是简单地使用扩展数据的整数索引和一个自定义的记号格式化程序来获取给定索引的适当日期字符串。
出:
loading /tmp/vpy_mat/lib/python3.7/site-packages/matplotlib/mpl-data/sample_data/msft.csv
import dateutil.parser
from matplotlib import cbook, dates
import matplotlib.pyplot as plt
from matplotlib.ticker import Formatter
import numpy as np


datafile = cbook.get_sample_data('msft.csv', asfileobj=False)
print('loading %s' % datafile)
msft_data = np.genfromtxt(
    datafile, delimiter=',', names=True,
    converters={0: lambda s: dates.date2num(dateutil.parser.parse(s))})


class MyFormatter(Formatter):
    def __init__(self, dates, fmt='%Y-%m-%d'):
        self.dates = dates
        self.fmt = fmt

    def __call__(self, x, pos=0):
        """Return the label for time x at position pos."""
        ind = int(round(x))
        if ind >= len(self.dates) or ind < 0:
            return ''
        return dates.num2date(self.dates[ind]).strftime(self.fmt)


fig, ax = plt.subplots()
ax.xaxis.set_major_formatter(MyFormatter(msft_data['Date']))
ax.plot(msft_data['Close'], 'o-')
fig.autofmt_xdate()
plt.show()
关键词:matplotlib代码示例,codex,python plot,pyplot Gallery generated by Sphinx-Gallery