注解
Click here 下载完整的示例代码
使用子图和gridspec组合两个子图
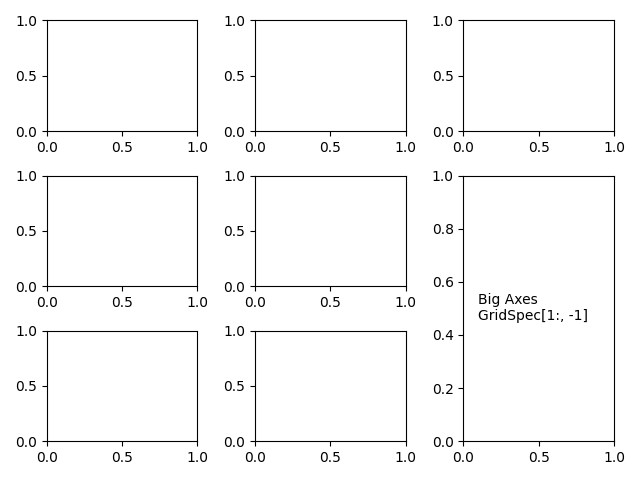
有时,我们希望在创建的轴布局中组合两个子批次 subplots . 我们可以得到 GridSpec 从轴上拆下覆盖的轴,然后用新的较大轴填充间隙。这里我们创建一个布局,最后一列中底部的两个轴组合在一起。
import matplotlib.pyplot as plt

fig, axs = plt.subplots(ncols=3, nrows=3)
gs = axs[1, 2].get_gridspec()
# remove the underlying axes
for ax in axs[1:, -1]:
    ax.remove()
axbig = fig.add_subplot(gs[1:, -1])
axbig.annotate('Big Axes \nGridSpec[1:, -1]', (0.1, 0.5),
               xycoords='axes fraction', va='center')

fig.tight_layout()

plt.show()
关键词:matplotlib代码示例,codex,python plot,pyplot Gallery generated by Sphinx-Gallery