注解
Click here 下载完整的示例代码
标题定位
Matplotlib可以居中显示打印标题,与一组轴的左侧齐平,与一组轴的右侧齐平。
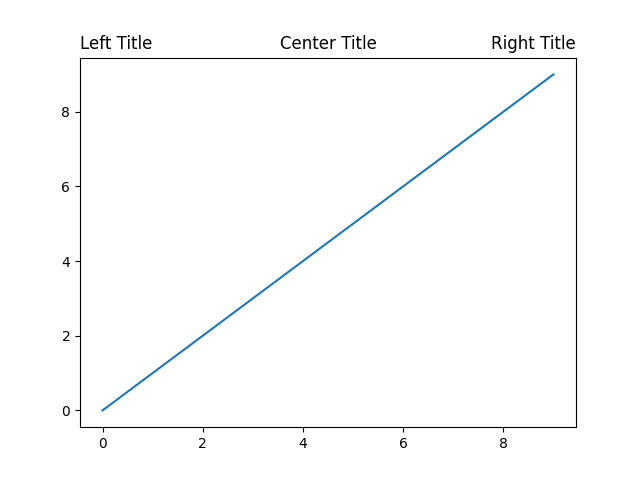
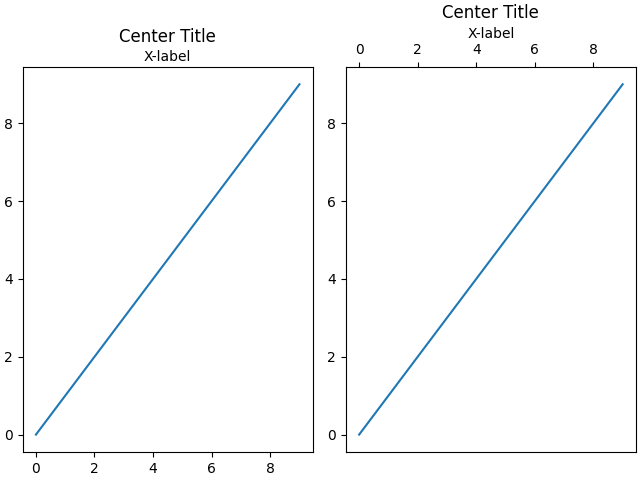
将自动选择垂直位置,以避免在最顶部的x轴上出现装饰(即标签和记号):
fig, axs = plt.subplots(1, 2, constrained_layout=True)

ax = axs[0]
ax.plot(range(10))
ax.xaxis.set_label_position('top')
ax.set_xlabel('X-label')
ax.set_title('Center Title')

ax = axs[1]
ax.plot(range(10))
ax.xaxis.set_label_position('top')
ax.xaxis.tick_top()
ax.set_xlabel('X-label')
ax.set_title('Center Title')
plt.show()
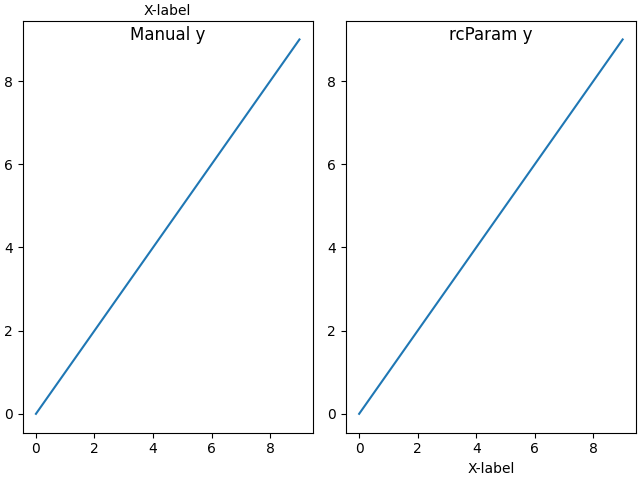
可以通过手动指定 y 标题或背景的夸尔格 rcParams["axes.titley"] (default: None) 在rcParams中。
fig, axs = plt.subplots(1, 2, constrained_layout=True)

ax = axs[0]
ax.plot(range(10))
ax.xaxis.set_label_position('top')
ax.set_xlabel('X-label')
ax.set_title('Manual y', y=1.0, pad=-14)

plt.rcParams['axes.titley'] = 1.0    # y is in axes-relative co-ordinates.
plt.rcParams['axes.titlepad'] = -14  # pad is in points...
ax = axs[1]
ax.plot(range(10))
ax.set_xlabel('X-label')
ax.set_title('rcParam y')

plt.show()
脚本的总运行时间: (0分1.477秒)
关键词:matplotlib代码示例,codex,python plot,pyplot Gallery generated by Sphinx-Gallery