注解
Click here 下载完整的示例代码
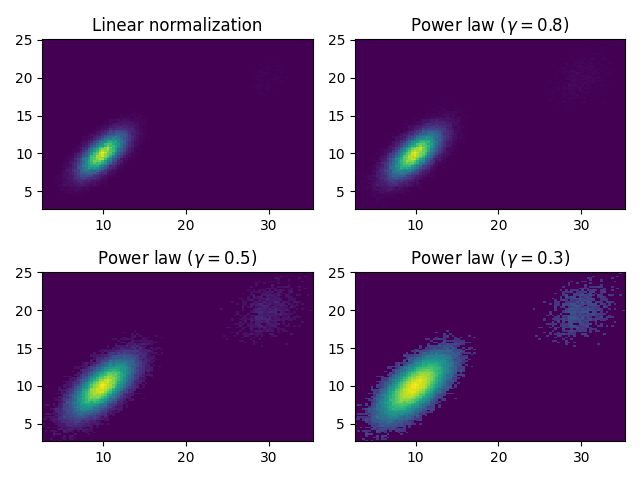
探索规范化
多元正态分布的各种归一化。
import matplotlib.pyplot as plt
import matplotlib.colors as mcolors
import numpy as np
from numpy.random import multivariate_normal


# Fixing random state for reproducibility.
np.random.seed(19680801)

data = np.vstack([
    multivariate_normal([10, 10], [[3, 2], [2, 3]], size=100000),
    multivariate_normal([30, 20], [[3, 1], [1, 3]], size=1000)
])

gammas = [0.8, 0.5, 0.3]

fig, axs = plt.subplots(nrows=2, ncols=2)

axs[0, 0].set_title('Linear normalization')
axs[0, 0].hist2d(data[:, 0], data[:, 1], bins=100)

for ax, gamma in zip(axs.flat[1:], gammas):
    ax.set_title(r'Power law $(\gamma=%1.1f)$' % gamma)
    ax.hist2d(data[:, 0], data[:, 1], bins=100, norm=mcolors.PowerNorm(gamma))

fig.tight_layout()

plt.show()
工具书类
以下函数、方法、类和模块的使用如本例所示:
出:
<function hist2d at 0x7faa00cfa8c8>
关键词:matplotlib代码示例,codex,python plot,pyplot Gallery generated by Sphinx-Gallery