注解
Click here 下载完整的示例代码
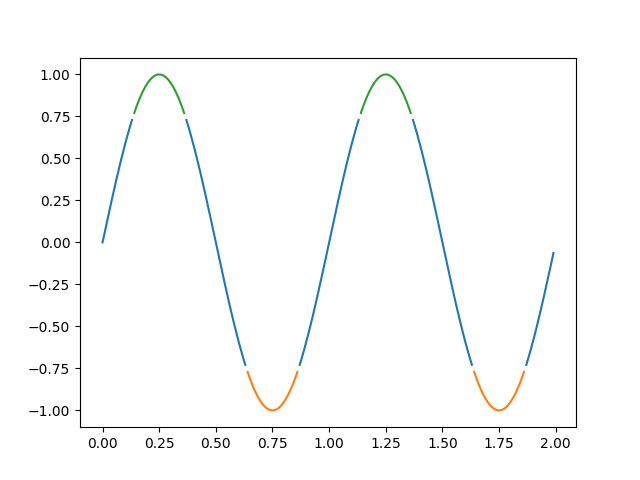
按y值着色
使用遮罩数组按y值绘制具有不同颜色的线。
import numpy as np
import matplotlib.pyplot as plt

t = np.arange(0.0, 2.0, 0.01)
s = np.sin(2 * np.pi * t)

upper = 0.77
lower = -0.77

supper = np.ma.masked_where(s < upper, s)
slower = np.ma.masked_where(s > lower, s)
smiddle = np.ma.masked_where((s < lower) | (s > upper), s)

fig, ax = plt.subplots()
ax.plot(t, smiddle, t, slower, t, supper)
plt.show()
工具书类
以下函数、方法、类和模块的使用如本例所示:
import matplotlib
matplotlib.axes.Axes.plot
matplotlib.pyplot.plot
出:
<function plot at 0x7faa00cfd0d0>
关键词:matplotlib代码示例,codex,python plot,pyplot Gallery generated by Sphinx-Gallery