注解
Click here 下载完整的示例代码
彩条勾标签演示
为颜色条制作自定义标签。
斯科特·辛克莱撰稿
import matplotlib.pyplot as plt
import numpy as np
from matplotlib import cm
from numpy.random import randn


# Fixing random state for reproducibility
np.random.seed(19680801)
使用垂直(默认)颜色条绘制
fig, ax = plt.subplots()

data = np.clip(randn(250, 250), -1, 1)

cax = ax.imshow(data, cmap=cm.coolwarm)
ax.set_title('Gaussian noise with vertical colorbar')

# Add colorbar, make sure to specify tick locations to match desired ticklabels
cbar = fig.colorbar(cax, ticks=[-1, 0, 1])
cbar.ax.set_yticklabels(['< -1', '0', '> 1'])  # vertically oriented colorbar
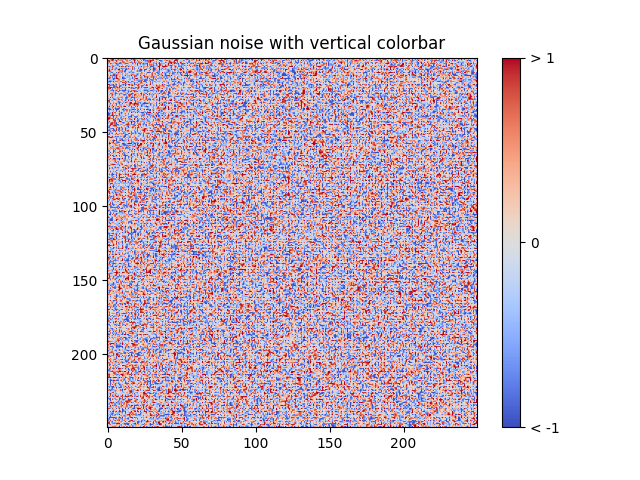
出:
[Text(1, -1, '< -1'), Text(1, 0, '0'), Text(1, 1, '> 1')]
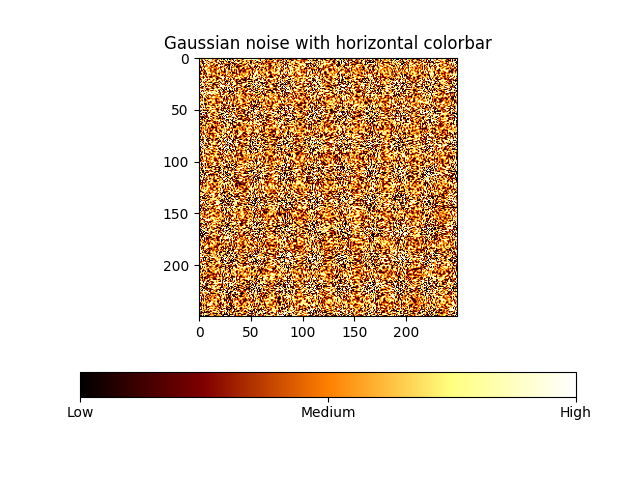
用水平颜色条绘图
fig, ax = plt.subplots()

data = np.clip(randn(250, 250), -1, 1)

cax = ax.imshow(data, cmap=cm.afmhot)
ax.set_title('Gaussian noise with horizontal colorbar')

cbar = fig.colorbar(cax, ticks=[-1, 0, 1], orientation='horizontal')
cbar.ax.set_xticklabels(['Low', 'Medium', 'High'])  # horizontal colorbar

plt.show()
脚本的总运行时间: (0分1.109秒)
关键词:matplotlib代码示例,codex,python plot,pyplot Gallery generated by Sphinx-Gallery