注解
Click here 下载完整的示例代码
自动设置刻度线标签
设置勾选自动放置的行为。
如果未显式设置刻度位置/标签,Matplotlib将尝试根据显示的数据及其限制自动选择它们。
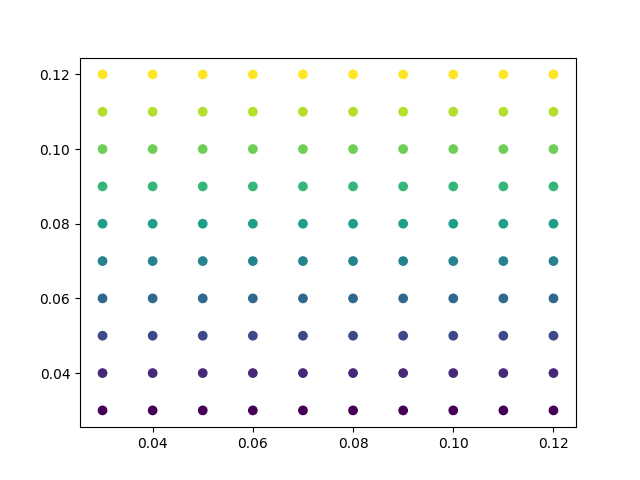
默认情况下,这将尝试选择沿轴分布的刻度位置:
import matplotlib.pyplot as plt
import numpy as np
np.random.seed(19680801)

fig, ax = plt.subplots()
dots = np.arange(10) / 100. + .03
x, y = np.meshgrid(dots, dots)
data = [x.ravel(), y.ravel()]
ax.scatter(*data, c=data[1])

出:
<matplotlib.collections.PathCollection object at 0x7fa9fc546940>
有时选择均匀分布的勾号会导致奇怪的勾号。如果希望matplotlib将记号保持在整数上,可以使用以下rcparams值更改此行为:
print(plt.rcParams['axes.autolimit_mode'])

# Now change this value and see the results
with plt.rc_context({'axes.autolimit_mode': 'round_numbers'}):
    fig, ax = plt.subplots()
    ax.scatter(*data, c=data[1])
出:
data
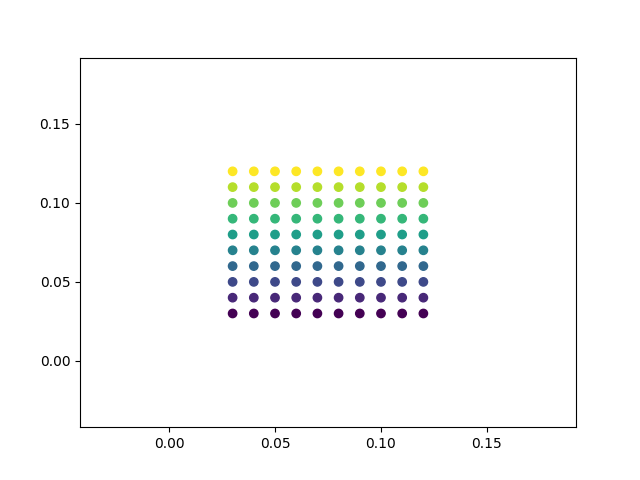
您还可以使用更改数据周围轴的边距 axes.(x,y)margin :
with plt.rc_context({'axes.autolimit_mode': 'round_numbers',
                     'axes.xmargin': .8,
                     'axes.ymargin': .8}):
    fig, ax = plt.subplots()
    ax.scatter(*data, c=data[1])

plt.show()
脚本的总运行时间: (0分1.083秒)
关键词:matplotlib代码示例,codex,python plot,pyplot Gallery generated by Sphinx-Gallery