注解
Click here 下载完整的示例代码
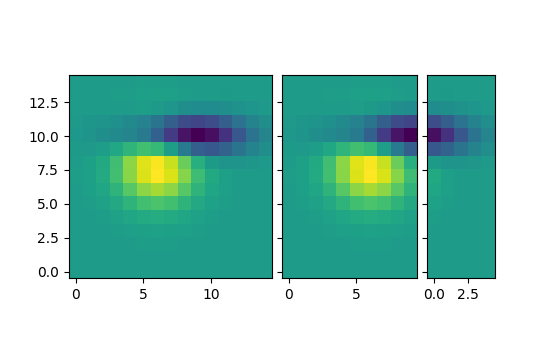
简单图像网格2
使用对齐多个不同大小的图像 ImageGrid .
from matplotlib import cbook
import matplotlib.pyplot as plt
from mpl_toolkits.axes_grid1 import ImageGrid


fig = plt.figure(figsize=(5.5, 3.5))
grid = ImageGrid(fig, 111,  # similar to subplot(111)
                 nrows_ncols=(1, 3),
                 axes_pad=0.1,
                 label_mode="L",
                 )

# demo image
Z = cbook.get_sample_data("axes_grid/bivariate_normal.npy", np_load=True)
im1 = Z
im2 = Z[:, :10]
im3 = Z[:, 10:]
vmin, vmax = Z.min(), Z.max()
for ax, im in zip(grid, [im1, im2, im3]):
    ax.imshow(im, origin="lower", vmin=vmin, vmax=vmax)

plt.show()
关键词:matplotlib代码示例,codex,python plot,pyplot Gallery generated by Sphinx-Gallery