注解
Click here 下载完整的示例代码
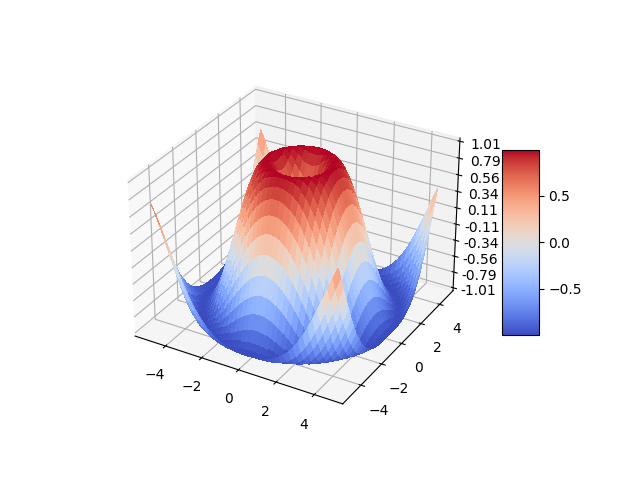
3D表面(彩色地图)
演示如何绘制使用CoolWarm颜色映射着色的3D曲面。使用“抗锯齿=假”使表面不透明。
还演示了使用线性定位器和Z轴刻度标签的自定义格式。
import matplotlib.pyplot as plt
from matplotlib import cm
from matplotlib.ticker import LinearLocator
import numpy as np

fig, ax = plt.subplots(subplot_kw={"projection": "3d"})

# Make data.
X = np.arange(-5, 5, 0.25)
Y = np.arange(-5, 5, 0.25)
X, Y = np.meshgrid(X, Y)
R = np.sqrt(X**2 + Y**2)
Z = np.sin(R)

# Plot the surface.
surf = ax.plot_surface(X, Y, Z, cmap=cm.coolwarm,
                       linewidth=0, antialiased=False)

# Customize the z axis.
ax.set_zlim(-1.01, 1.01)
ax.zaxis.set_major_locator(LinearLocator(10))
# A StrMethodFormatter is used automatically
ax.zaxis.set_major_formatter('{x:.02f}')

# Add a color bar which maps values to colors.
fig.colorbar(surf, shrink=0.5, aspect=5)

plt.show()
工具书类
以下函数、方法、类和模块的使用如本例所示:
关键词:matplotlib代码示例,codex,python plot,pyplot Gallery generated by Sphinx-Gallery