matplotlib.axis
matplotlib.axis.Axis.set_major_locator
Axis.
set_major_locator
设置主断续器的定位器。
Locator
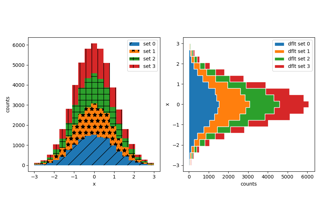
填充图案填充直方图
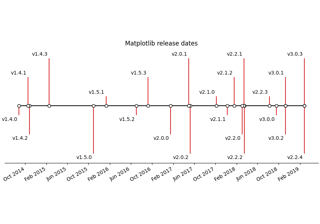
创建带有线条、日期和文本的时间线
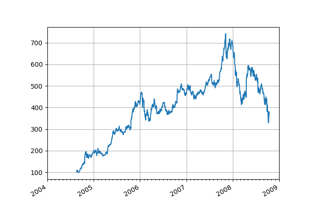
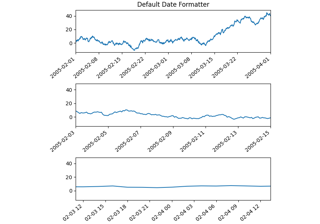
日期刻度线标签
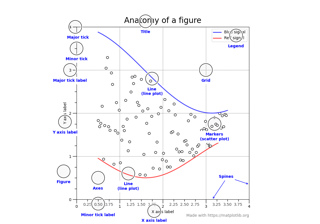
人体解剖学
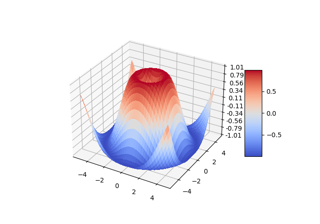
3D表面(彩色地图)
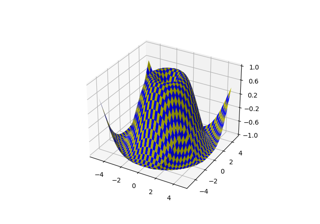
3D表面(棋盘)
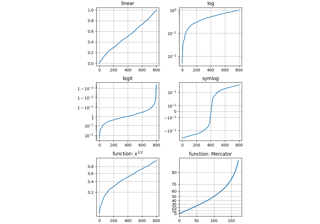
规模
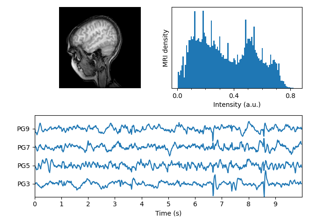
磁共振脑电图
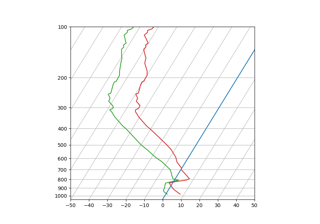
歪斜logp图:使用转换和自定义投影
刻度之间的标签居中
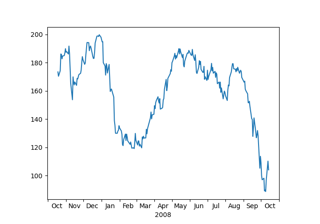
使用ConciseDataformatter格式化日期刻度
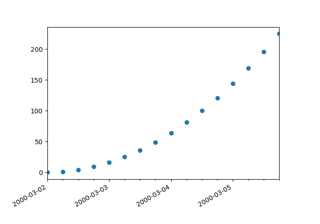
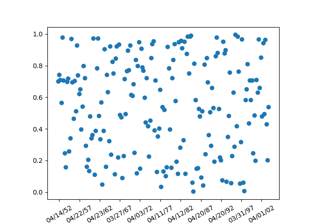
演示转换日期
日期演示规则
主次滴答声
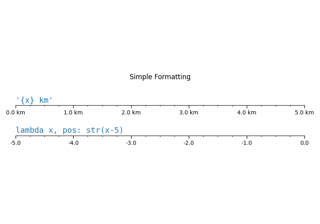
滴答格式化程序
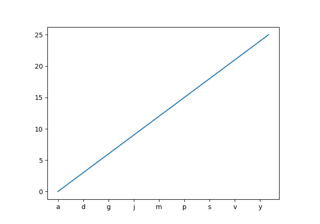
从值列表中设置刻度线标签
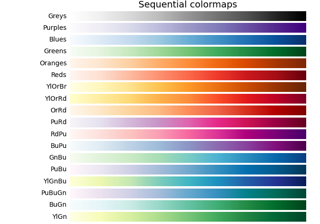
在Matplotlib中选择颜色映射
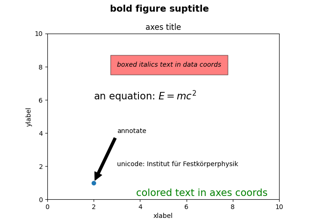
matplotlib图中的文本