注解
Click here 下载完整的示例代码
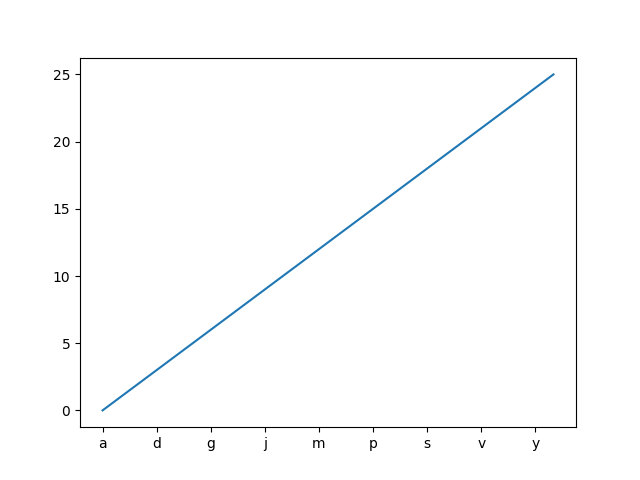
从值列表中设置刻度线标签
使用 Axes.set_xticks 在当前选定的记号上设置记号标签。但是,您可能希望允许matplotlib动态选择记号数及其间距。
在这种情况下,最好从勾号处的值确定勾号标签。下面的示例演示如何执行此操作。
注:The ticker.MaxNLocator 用于确保刻度值采用整数值。
import matplotlib.pyplot as plt
from matplotlib.ticker import MaxNLocator


fig, ax = plt.subplots()
xs = range(26)
ys = range(26)
labels = list('abcdefghijklmnopqrstuvwxyz')


def format_fn(tick_val, tick_pos):
    if int(tick_val) in xs:
        return labels[int(tick_val)]
    else:
        return ''


# A FuncFormatter is created automatically.
ax.xaxis.set_major_formatter(format_fn)
ax.xaxis.set_major_locator(MaxNLocator(integer=True))
ax.plot(xs, ys)
plt.show()
工具书类
以下函数、方法、类和模块的使用如本例所示:
关键词:matplotlib代码示例,codex,python plot,pyplot Gallery generated by Sphinx-Gallery