注解
Click here 下载完整的示例代码
使用ConciseDataformatter格式化日期刻度
找到好的刻度值并格式化具有日期数据的轴的刻度通常是一个挑战。 ConciseDateFormatter 旨在改进为刻度线标签选择的字符串,并尽可能减少这些刻度线标签中使用的字符串。
注解
此格式设置工具是将来版本matplotlib中成为默认日期刻度格式设置工具的候选者。请向Github存储库或邮件列表报告任何需要改进的问题或建议。
import datetime
import matplotlib.pyplot as plt
import matplotlib.dates as mdates
import numpy as np
首先是默认格式设置工具。
base = datetime.datetime(2005, 2, 1)
dates = [base + datetime.timedelta(hours=(2 * i)) for i in range(732)]
N = len(dates)
np.random.seed(19680801)
y = np.cumsum(np.random.randn(N))

fig, axs = plt.subplots(3, 1, constrained_layout=True, figsize=(6, 6))
lims = [(np.datetime64('2005-02'), np.datetime64('2005-04')),
        (np.datetime64('2005-02-03'), np.datetime64('2005-02-15')),
        (np.datetime64('2005-02-03 11:00'), np.datetime64('2005-02-04 13:20'))]
for nn, ax in enumerate(axs):
    ax.plot(dates, y)
    ax.set_xlim(lims[nn])
    # rotate_labels...
    for label in ax.get_xticklabels():
        label.set_rotation(40)
        label.set_horizontalalignment('right')
axs[0].set_title('Default Date Formatter')
plt.show()
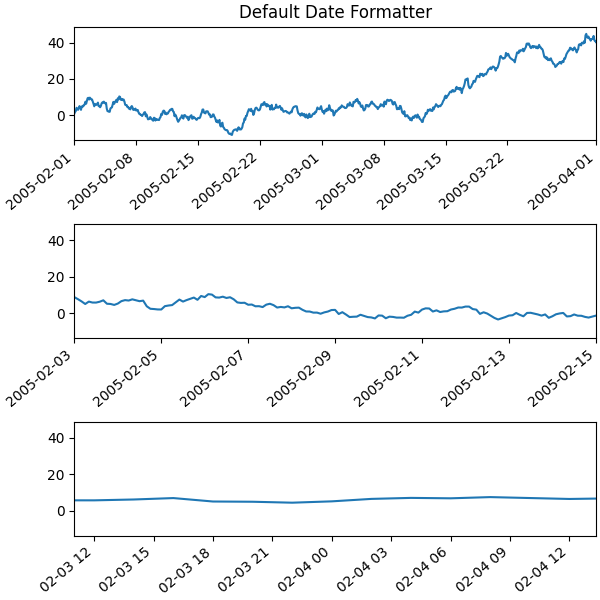
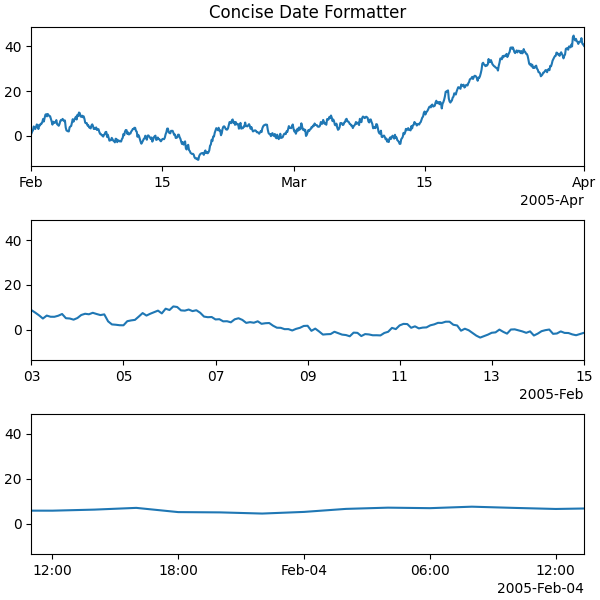
默认的日期格式化程序非常冗长,因此我们可以选择使用 ConciseDateFormatter ,如下所示。请注意,在本例中,不需要像对默认格式设置工具那样旋转标签,因为标签尽可能小。
fig, axs = plt.subplots(3, 1, constrained_layout=True, figsize=(6, 6))
for nn, ax in enumerate(axs):
    locator = mdates.AutoDateLocator(minticks=3, maxticks=7)
    formatter = mdates.ConciseDateFormatter(locator)
    ax.xaxis.set_major_locator(locator)
    ax.xaxis.set_major_formatter(formatter)

    ax.plot(dates, y)
    ax.set_xlim(lims[nn])
axs[0].set_title('Concise Date Formatter')

plt.show()
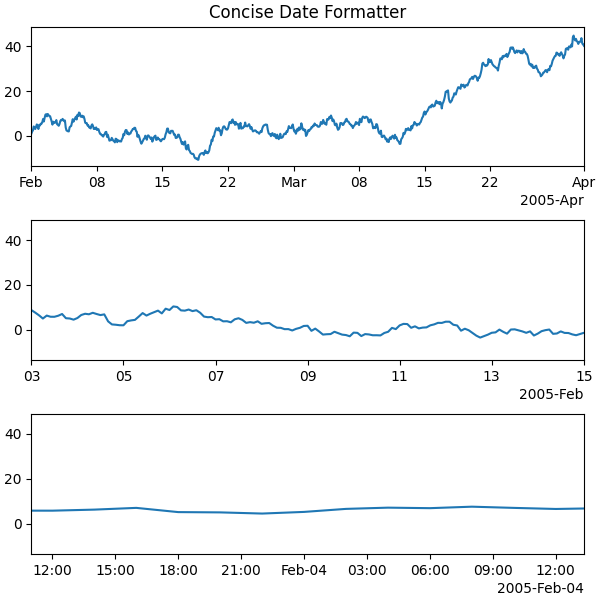
如果要使用此转换器调用具有日期的轴,则使用执行导入操作的Units注册表可能最方便:
import matplotlib.units as munits
converter = mdates.ConciseDateConverter()
munits.registry[np.datetime64] = converter
munits.registry[datetime.date] = converter
munits.registry[datetime.datetime] = converter

fig, axs = plt.subplots(3, 1, figsize=(6, 6), constrained_layout=True)
for nn, ax in enumerate(axs):
    ax.plot(dates, y)
    ax.set_xlim(lims[nn])
axs[0].set_title('Concise Date Formatter')

plt.show()
日期格式本地化
如果不希望使用默认格式,则可以通过操作三个字符串列表之一来本地化日期格式。
这个 formatter.formats 格式列表是用于普通刻度线标签的,有六个级别:年、月、天、小时、分钟、秒。这个 formatter.offset_formats 是如何格式化轴右侧的“偏移”字符串。这通常比勾号标签要详细得多。最后, formatter.zero_formats 标记的格式为“零”。这些是勾号值,可以是年、月或月的第一天,也可以是零小时、分钟或秒。这些通常与上面一级刻度的格式相同。例如,如果轴限制意味着刻度大多为天,那么我们将2005年3月1日标记为“mar”。如果轴限值大部分是小时,我们将2月4日00:00标记为“2月4日”。
请注意,这些格式列表也可以传递给 ConciseDateFormatter 作为可选关卡。
这里我们将标签修改为“日-月-年”,而不是ISO“年-月-日”:
fig, axs = plt.subplots(3, 1, constrained_layout=True, figsize=(6, 6))

for nn, ax in enumerate(axs):
    locator = mdates.AutoDateLocator()
    formatter = mdates.ConciseDateFormatter(locator)
    formatter.formats = ['%y',  # ticks are mostly years
                         '%b',       # ticks are mostly months
                         '%d',       # ticks are mostly days
                         '%H:%M',    # hrs
                         '%H:%M',    # min
                         '%S.%f', ]  # secs
    # these are mostly just the level above...
    formatter.zero_formats = [''] + formatter.formats[:-1]
    # ...except for ticks that are mostly hours, then it is nice to have
    # month-day:
    formatter.zero_formats[3] = '%d-%b'

    formatter.offset_formats = ['',
                                '%Y',
                                '%b %Y',
                                '%d %b %Y',
                                '%d %b %Y',
                                '%d %b %Y %H:%M', ]
    ax.xaxis.set_major_locator(locator)
    ax.xaxis.set_major_formatter(formatter)

    ax.plot(dates, y)
    ax.set_xlim(lims[nn])
axs[0].set_title('Concise Date Formatter')

plt.show()

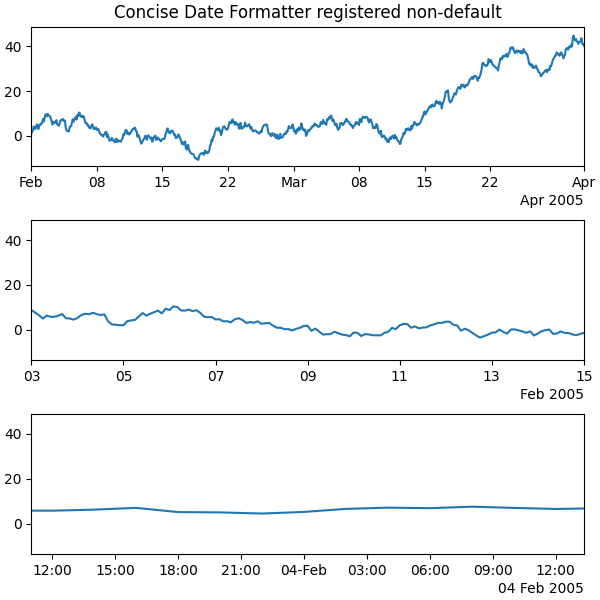
用本地化注册转换器
ConciseDateFormatter 没有rcparms条目,但可以通过将kwarg传递给 ConciseDateConverter 并在Units注册表中注册要使用的数据类型:
import datetime

formats = ['%y',          # ticks are mostly years
           '%b',     # ticks are mostly months
           '%d',     # ticks are mostly days
           '%H:%M',  # hrs
           '%H:%M',  # min
           '%S.%f', ]  # secs
# these can be the same, except offset by one level....
zero_formats = [''] + formats[:-1]
# ...except for ticks that are mostly hours, then its nice to have month-day
zero_formats[3] = '%d-%b'
offset_formats = ['',
                  '%Y',
                  '%b %Y',
                  '%d %b %Y',
                  '%d %b %Y',
                  '%d %b %Y %H:%M', ]

converter = mdates.ConciseDateConverter(
    formats=formats, zero_formats=zero_formats, offset_formats=offset_formats)

munits.registry[np.datetime64] = converter
munits.registry[datetime.date] = converter
munits.registry[datetime.datetime] = converter

fig, axs = plt.subplots(3, 1, constrained_layout=True, figsize=(6, 6))
for nn, ax in enumerate(axs):
    ax.plot(dates, y)
    ax.set_xlim(lims[nn])
axs[0].set_title('Concise Date Formatter registered non-default')

plt.show()
脚本的总运行时间: (0分3.469秒)
关键词:matplotlib代码示例,codex,python plot,pyplot Gallery generated by Sphinx-Gallery