注解
Click here 下载完整的示例代码
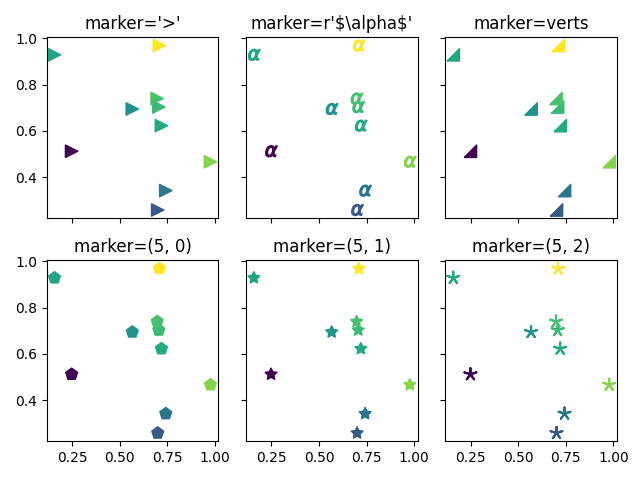
标记示例
使用不同的方法指定标记的示例。
有关所有标记的列表,请参见 matplotlib.markers 文档。
import numpy as np
import matplotlib.pyplot as plt

# Fixing random state for reproducibility
np.random.seed(19680801)

x = np.random.rand(10)
y = np.random.rand(10)
z = np.sqrt(x**2 + y**2)

fig, axs = plt.subplots(2, 3, sharex=True, sharey=True)

# marker symbol
axs[0, 0].scatter(x, y, s=80, c=z, marker=">")
axs[0, 0].set_title("marker='>'")

# marker from TeX
axs[0, 1].scatter(x, y, s=80, c=z, marker=r'$\alpha$')
axs[0, 1].set_title(r"marker=r'\$\alpha\$'")

# marker from path
verts = [[-1, -1], [1, -1], [1, 1], [-1, -1]]
axs[0, 2].scatter(x, y, s=80, c=z, marker=verts)
axs[0, 2].set_title("marker=verts")

# regular polygon marker
axs[1, 0].scatter(x, y, s=80, c=z, marker=(5, 0))
axs[1, 0].set_title("marker=(5, 0)")

# regular star marker
axs[1, 1].scatter(x, y, s=80, c=z, marker=(5, 1))
axs[1, 1].set_title("marker=(5, 1)")

# regular asterisk marker
axs[1, 2].scatter(x, y, s=80, c=z, marker=(5, 2))
axs[1, 2].set_title("marker=(5, 2)")

plt.tight_layout()
plt.show()
关键词:matplotlib代码示例,codex,python plot,pyplot Gallery generated by Sphinx-Gallery