注解
Click here 下载完整的示例代码
pColor网格和着色
axes.Axes.pcolormesh 和 pcolor 对于网格的布局和网格点之间的着色,有一些选项。
一般来说,如果 Z 有形状 (米,牛) 然后是网格 X 和 Y 可以用任一形状指定 (M+1,N+1) 或 (米,牛) ,取决于 shading 关键字参数。请注意,下面我们指定了向量 x 长度N或N+1和 y 长度M或M+1,以及 pcolormesh 在内部生成网格矩阵 X 和 Y 从输入向量。
import matplotlib
import matplotlib.pyplot as plt
import numpy as np
平面明暗处理
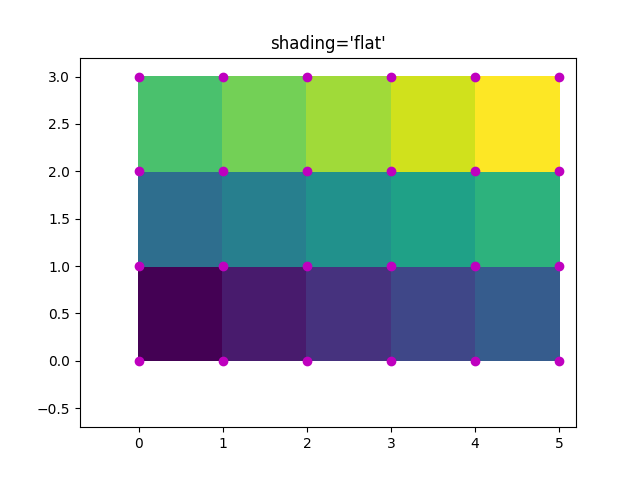
假设最少的网格规范是 shading='flat' 如果网格中的数据大于一个维度 (M+1,N+1) . 那样的话 X 和 Y 指定使用中的值着色的四边形的角 Z . 这里我们指定 (3, 5) 四边形 X 和 Y 那是 (4, 6) .
nrows = 3
ncols = 5
Z = np.arange(nrows * ncols).reshape(nrows, ncols)
x = np.arange(ncols + 1)
y = np.arange(nrows + 1)

fig, ax = plt.subplots()
ax.pcolormesh(x, y, Z, shading='flat', vmin=Z.min(), vmax=Z.max())


def _annotate(ax, x, y, title):
    # this all gets repeated below:
    X, Y = np.meshgrid(x, y)
    ax.plot(X.flat, Y.flat, 'o', color='m')
    ax.set_xlim(-0.7, 5.2)
    ax.set_ylim(-0.7, 3.2)
    ax.set_title(title)

_annotate(ax, x, y, "shading='flat'")
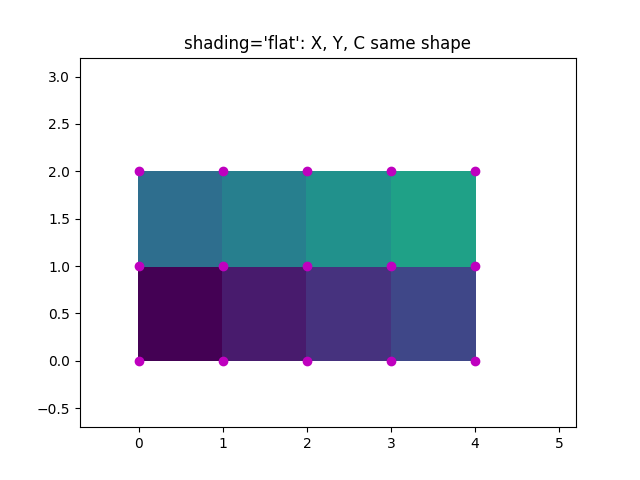
平面着色,相同形状网格
然而,数据通常是在 X 和 Y 匹配的形状 Z . 从Matplotlib v3.3开始, shading='flat' 在这种情况下,将引发警告,并且 Z 都掉下来了。最后一行和最后一列的删除是Matplotlib在v3.3之前所做的,并且与Matlab所做的是兼容的。
出:
/pb1/rst_repos/git/matplotlib/examples/images_contours_and_fields/pcolormesh_grids.py:66: MatplotlibDeprecationWarning: shading='flat' when X and Y have the same dimensions as C is deprecated since 3.3.  Either specify the corners of the quadrilaterals with X and Y, or pass shading='auto', 'nearest' or 'gouraud', or set rcParams['pcolor.shading'].  This will become an error two minor releases later.
  ax.pcolormesh(x, y, Z, shading='flat', vmin=Z.min(), vmax=Z.max())
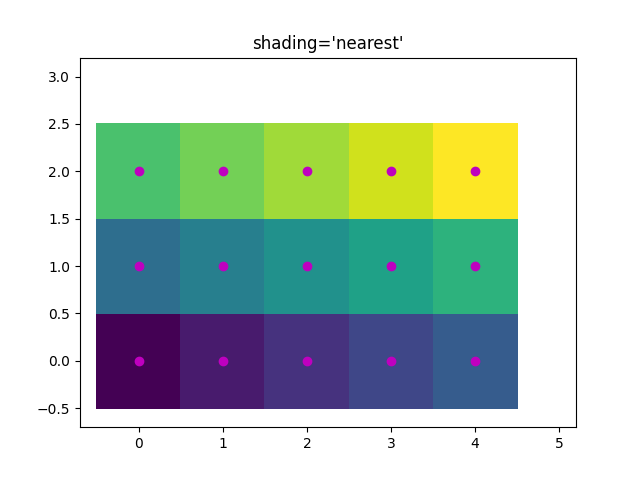
最近着色,相同形状网格
通常,删除一行和一列数据并不是用户在创建 X , Y 和 Z 都是一样的形状。对于这种情况,Matplotlib允许 shading='nearest' 并将彩色四边形集中在网格点上。
如果传递的栅格形状不正确 shading='nearest' 出现错误。
fig, ax = plt.subplots()
ax.pcolormesh(x, y, Z, shading='nearest', vmin=Z.min(), vmax=Z.max())
_annotate(ax, x, y, "shading='nearest'")
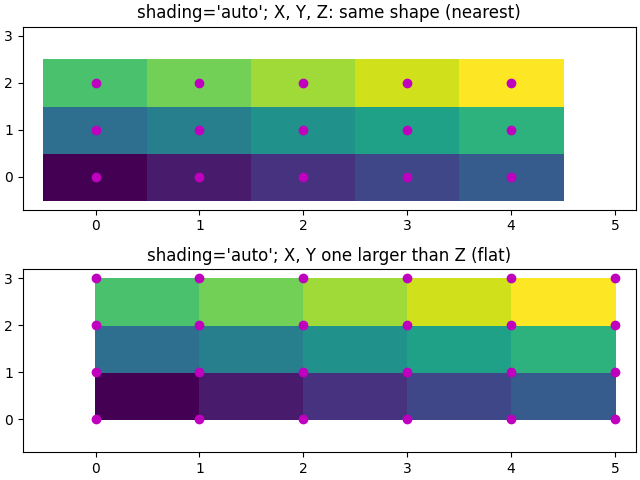
自动着色
在这种情况下,用户可能希望代码自动选择要使用的代码 shading='auto' 将决定是否使用“平面”或“最近的”阴影的形状的基础上 X , Y 和 Z .
fig, axs = plt.subplots(2, 1, constrained_layout=True)
ax = axs[0]
x = np.arange(ncols)
y = np.arange(nrows)
ax.pcolormesh(x, y, Z, shading='auto', vmin=Z.min(), vmax=Z.max())
_annotate(ax, x, y, "shading='auto'; X, Y, Z: same shape (nearest)")

ax = axs[1]
x = np.arange(ncols + 1)
y = np.arange(nrows + 1)
ax.pcolormesh(x, y, Z, shading='auto', vmin=Z.min(), vmax=Z.max())
_annotate(ax, x, y, "shading='auto'; X, Y one larger than Z (flat)")
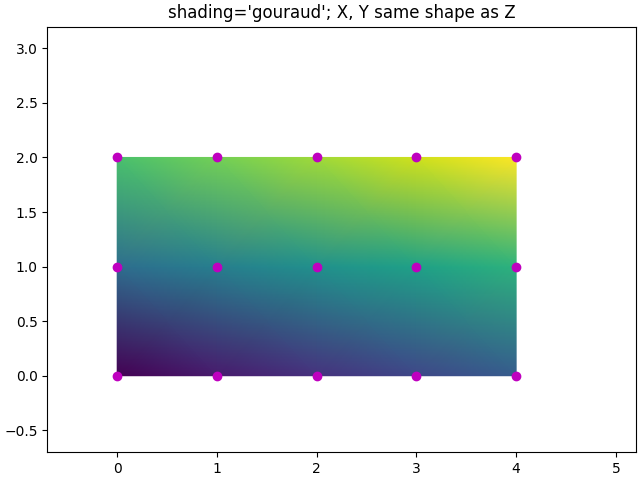
古劳德阴影
Gouraud shading 也可以指定,其中四边形中的颜色在网格点之间线性插值。形状 X , Y , Z 一定是一样的。
工具书类
本例中显示了以下函数和方法的使用:
出:
<function pcolormesh at 0x7faa00cfaea0>
脚本的总运行时间: (0分2.281秒)
关键词:matplotlib代码示例,codex,python plot,pyplot Gallery generated by Sphinx-Gallery