注解
Click here 下载完整的示例代码
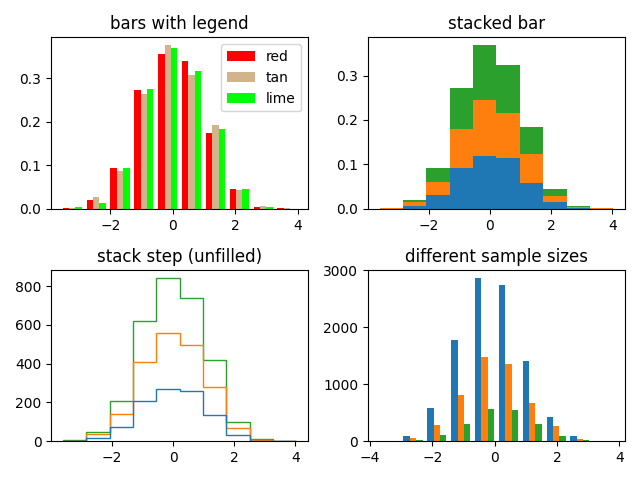
具有多个数据集的直方图(hist)函数
用多个样本集绘制柱状图并演示:
- 对多个样本集使用图例
- 堆叠条
- 无填充的阶梯曲线
- 不同样本量的数据集
选择不同的仓位计数和大小会显著影响直方图的形状。Astropy文档有一个关于如何选择这些参数的重要部分:http://docs.astropy.org/en/stable/visualization/histogram.html
import numpy as np
import matplotlib.pyplot as plt

np.random.seed(19680801)

n_bins = 10
x = np.random.randn(1000, 3)

fig, ((ax0, ax1), (ax2, ax3)) = plt.subplots(nrows=2, ncols=2)

colors = ['red', 'tan', 'lime']
ax0.hist(x, n_bins, density=True, histtype='bar', color=colors, label=colors)
ax0.legend(prop={'size': 10})
ax0.set_title('bars with legend')

ax1.hist(x, n_bins, density=True, histtype='bar', stacked=True)
ax1.set_title('stacked bar')

ax2.hist(x, n_bins, histtype='step', stacked=True, fill=False)
ax2.set_title('stack step (unfilled)')

# Make a multiple-histogram of data-sets with different length.
x_multi = [np.random.randn(n) for n in [10000, 5000, 2000]]
ax3.hist(x_multi, n_bins, histtype='bar')
ax3.set_title('different sample sizes')

fig.tight_layout()
plt.show()
关键词:matplotlib代码示例,codex,python plot,pyplot Gallery generated by Sphinx-Gallery