注解
Click here 下载完整的示例代码
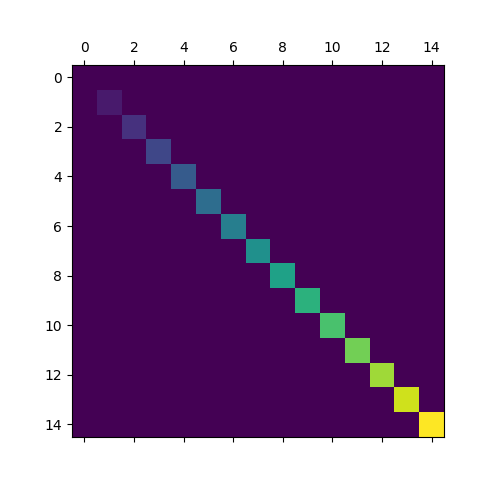
马赛
matshow 将二维矩阵或数组可视化为彩色编码图像。
import matplotlib.pyplot as plt
import numpy as np

# a 2D array with linearly increasing values on the diagonal
a = np.diag(range(15))

plt.matshow(a)

plt.show()
工具书类
本例中显示了以下函数和方法的使用:
import matplotlib
matplotlib.axes.Axes.matshow
matplotlib.pyplot.matshow
出:
<function matshow at 0x7faa00ce81e0>
关键词:matplotlib代码示例,codex,python plot,pyplot Gallery generated by Sphinx-Gallery