注解
Click here 下载完整的示例代码
编写自定义图例
一件一件地编写自定义图例。
有时,您不需要与所绘制的数据显式绑定的图例。例如,假设您绘制了10行,但不希望为每行显示一个图例项。如果你只是简单的画线和调用 ax.legend() ,您将得到以下信息:
from matplotlib import rcParams, cycler
import matplotlib.pyplot as plt
import numpy as np

# Fixing random state for reproducibility
np.random.seed(19680801)

N = 10
data = (np.geomspace(1, 10, 100) + np.random.randn(N, 100)).T
cmap = plt.cm.coolwarm
rcParams['axes.prop_cycle'] = cycler(color=cmap(np.linspace(0, 1, N)))

fig, ax = plt.subplots()
lines = ax.plot(data)
ax.legend()
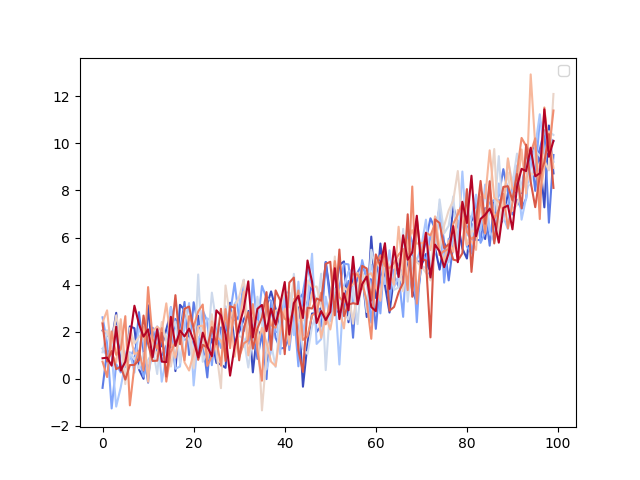
出:
No handles with labels found to put in legend.

<matplotlib.legend.Legend object at 0x7faa0ce75dd8>
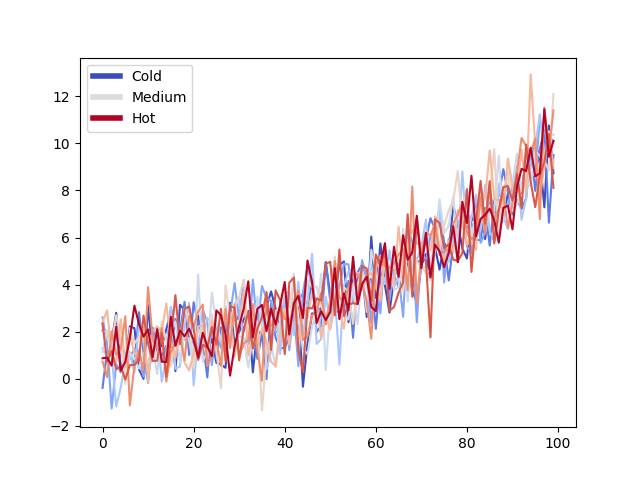
请注意,没有创建图例条目。在这种情况下,我们可以使用Matplotlib对象编写图例,这些对象没有显式地绑定到绘制的数据。例如:
from matplotlib.lines import Line2D
custom_lines = [Line2D([0], [0], color=cmap(0.), lw=4),
                Line2D([0], [0], color=cmap(.5), lw=4),
                Line2D([0], [0], color=cmap(1.), lw=4)]

fig, ax = plt.subplots()
lines = ax.plot(data)
ax.legend(custom_lines, ['Cold', 'Medium', 'Hot'])
出:
<matplotlib.legend.Legend object at 0x7faa0a8e1048>
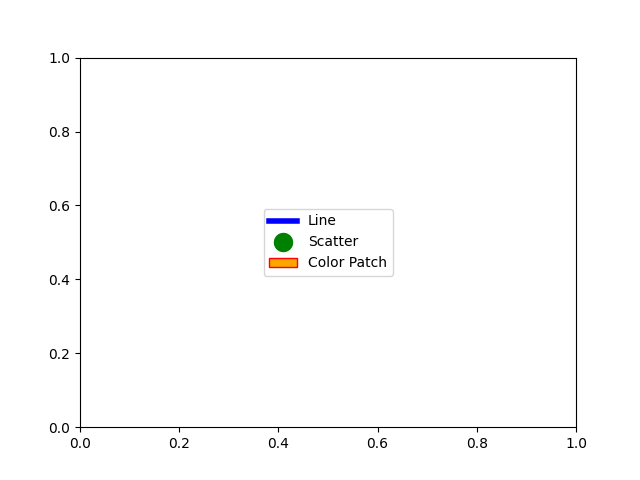
还有许多其他matplotlib对象可以这样使用。在下面的代码中,我们列出了一些常见的代码。
from matplotlib.patches import Patch
from matplotlib.lines import Line2D

legend_elements = [Line2D([0], [0], color='b', lw=4, label='Line'),
                   Line2D([0], [0], marker='o', color='w', label='Scatter',
                          markerfacecolor='g', markersize=15),
                   Patch(facecolor='orange', edgecolor='r',
                         label='Color Patch')]

# Create the figure
fig, ax = plt.subplots()
ax.legend(handles=legend_elements, loc='center')

plt.show()
脚本的总运行时间: (0分1.779秒)
关键词:matplotlib代码示例,codex,python plot,pyplot Gallery generated by Sphinx-Gallery