注解
Click here 下载完整的示例代码
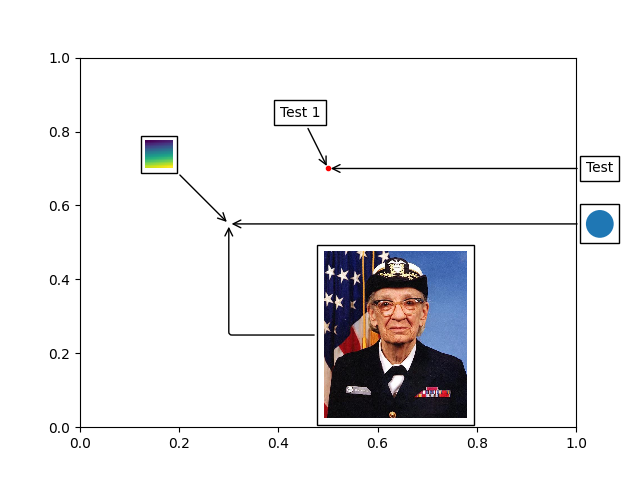
演示注释框
注释框艺术家使用偏移框创建注释。这个例子演示了三种不同的偏移框:TextArea、DrawingArea和OffsetImage。AnnotationBbox提供了比使用axes方法annotate更细粒度的控制。
import matplotlib.pyplot as plt
import numpy as np

from matplotlib.patches import Circle
from matplotlib.offsetbox import (TextArea, DrawingArea, OffsetImage,
                                  AnnotationBbox)
from matplotlib.cbook import get_sample_data


fig, ax = plt.subplots()

# Define a 1st position to annotate (display it with a marker)
xy = (0.5, 0.7)
ax.plot(xy[0], xy[1], ".r")

# Annotate the 1st position with a text box ('Test 1')
offsetbox = TextArea("Test 1", minimumdescent=False)

ab = AnnotationBbox(offsetbox, xy,
                    xybox=(-20, 40),
                    xycoords='data',
                    boxcoords="offset points",
                    arrowprops=dict(arrowstyle="->"))
ax.add_artist(ab)

# Annotate the 1st position with another text box ('Test')
offsetbox = TextArea("Test", minimumdescent=False)

ab = AnnotationBbox(offsetbox, xy,
                    xybox=(1.02, xy[1]),
                    xycoords='data',
                    boxcoords=("axes fraction", "data"),
                    box_alignment=(0., 0.5),
                    arrowprops=dict(arrowstyle="->"))
ax.add_artist(ab)

# Define a 2nd position to annotate (don't display with a marker this time)
xy = [0.3, 0.55]

# Annotate the 2nd position with a circle patch
da = DrawingArea(20, 20, 0, 0)
p = Circle((10, 10), 10)
da.add_artist(p)

ab = AnnotationBbox(da, xy,
                    xybox=(1.02, xy[1]),
                    xycoords='data',
                    boxcoords=("axes fraction", "data"),
                    box_alignment=(0., 0.5),
                    arrowprops=dict(arrowstyle="->"))

ax.add_artist(ab)

# Annotate the 2nd position with an image (a generated array of pixels)
arr = np.arange(100).reshape((10, 10))
im = OffsetImage(arr, zoom=2)
im.image.axes = ax

ab = AnnotationBbox(im, xy,
                    xybox=(-50., 50.),
                    xycoords='data',
                    boxcoords="offset points",
                    pad=0.3,
                    arrowprops=dict(arrowstyle="->"))

ax.add_artist(ab)

# Annotate the 2nd position with another image (a Grace Hopper portrait)
with get_sample_data("grace_hopper.png") as file:
    arr_img = plt.imread(file, format='png')

imagebox = OffsetImage(arr_img, zoom=0.2)
imagebox.image.axes = ax

ab = AnnotationBbox(imagebox, xy,
                    xybox=(120., -80.),
                    xycoords='data',
                    boxcoords="offset points",
                    pad=0.5,
                    arrowprops=dict(
                        arrowstyle="->",
                        connectionstyle="angle,angleA=0,angleB=90,rad=3")
                    )

ax.add_artist(ab)

# Fix the display limits to see everything
ax.set_xlim(0, 1)
ax.set_ylim(0, 1)

plt.show()
工具书类
本例中显示了以下函数、方法和类的使用:
出:
<function show at 0x7faa00ce20d0>
关键词:matplotlib代码示例,codex,python plot,pyplot Gallery generated by Sphinx-Gallery