注解
Click here 下载完整的示例代码
小提琴绘图基础
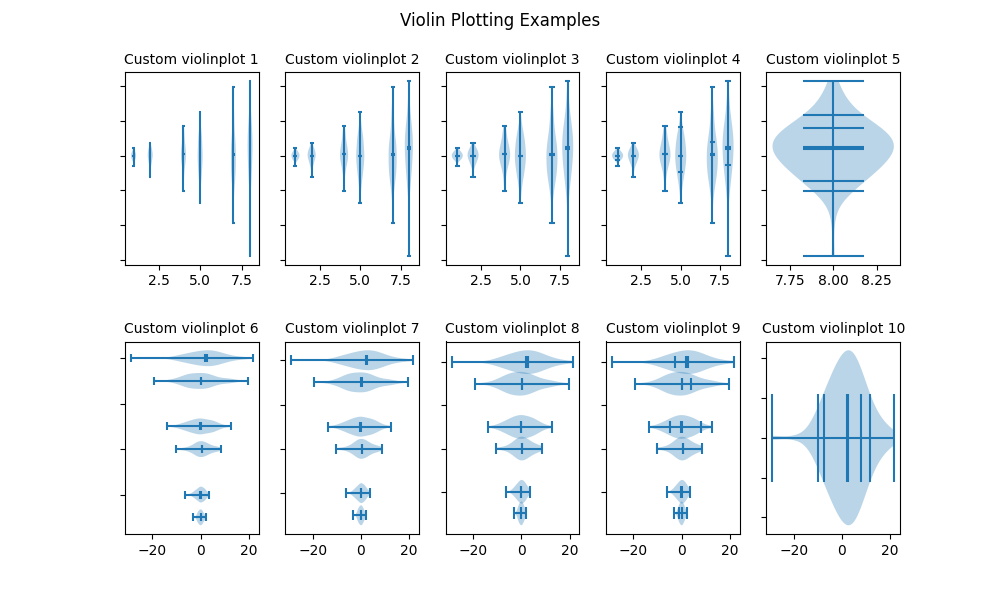
小提琴图类似于柱状图和方框图,它们显示了样本概率分布的抽象表示。小提琴图并没有显示落入箱中的数据点计数或顺序统计,而是使用核密度估计(kde)来计算样本的经验分布。这个计算由几个参数控制。这个例子演示了如何修改计算kde的点数。 (points )以及如何修改kde的带宽 (bw_method )
有关小提琴情节和KDE的更多信息,scikit学习文档有一个很好的部分:https://scikit-learn.org/stable/modules/density.html
import numpy as np
import matplotlib.pyplot as plt

# Fixing random state for reproducibility
np.random.seed(19680801)


# fake data
fs = 10  # fontsize
pos = [1, 2, 4, 5, 7, 8]
data = [np.random.normal(0, std, size=100) for std in pos]

fig, axs = plt.subplots(nrows=2, ncols=5, figsize=(10, 6))

axs[0, 0].violinplot(data, pos, points=20, widths=0.3,
                     showmeans=True, showextrema=True, showmedians=True)
axs[0, 0].set_title('Custom violinplot 1', fontsize=fs)

axs[0, 1].violinplot(data, pos, points=40, widths=0.5,
                     showmeans=True, showextrema=True, showmedians=True,
                     bw_method='silverman')
axs[0, 1].set_title('Custom violinplot 2', fontsize=fs)

axs[0, 2].violinplot(data, pos, points=60, widths=0.7, showmeans=True,
                     showextrema=True, showmedians=True, bw_method=0.5)
axs[0, 2].set_title('Custom violinplot 3', fontsize=fs)

axs[0, 3].violinplot(data, pos, points=60, widths=0.7, showmeans=True,
                     showextrema=True, showmedians=True, bw_method=0.5,
                     quantiles=[[0.1], [], [], [0.175, 0.954], [0.75], [0.25]])
axs[0, 3].set_title('Custom violinplot 4', fontsize=fs)

axs[0, 4].violinplot(data[-1:], pos[-1:], points=60, widths=0.7,
                     showmeans=True, showextrema=True, showmedians=True,
                     quantiles=[0.05, 0.1, 0.8, 0.9], bw_method=0.5)
axs[0, 4].set_title('Custom violinplot 5', fontsize=fs)

axs[1, 0].violinplot(data, pos, points=80, vert=False, widths=0.7,
                     showmeans=True, showextrema=True, showmedians=True)
axs[1, 0].set_title('Custom violinplot 6', fontsize=fs)

axs[1, 1].violinplot(data, pos, points=100, vert=False, widths=0.9,
                     showmeans=True, showextrema=True, showmedians=True,
                     bw_method='silverman')
axs[1, 1].set_title('Custom violinplot 7', fontsize=fs)

axs[1, 2].violinplot(data, pos, points=200, vert=False, widths=1.1,
                     showmeans=True, showextrema=True, showmedians=True,
                     bw_method=0.5)
axs[1, 2].set_title('Custom violinplot 8', fontsize=fs)

axs[1, 3].violinplot(data, pos, points=200, vert=False, widths=1.1,
                     showmeans=True, showextrema=True, showmedians=True,
                     quantiles=[[0.1], [], [], [0.175, 0.954], [0.75], [0.25]],
                     bw_method=0.5)
axs[1, 3].set_title('Custom violinplot 9', fontsize=fs)

axs[1, 4].violinplot(data[-1:], pos[-1:], points=200, vert=False, widths=1.1,
                     showmeans=True, showextrema=True, showmedians=True,
                     quantiles=[0.05, 0.1, 0.8, 0.9], bw_method=0.5)
axs[1, 4].set_title('Custom violinplot 10', fontsize=fs)


for ax in axs.flat:
    ax.set_yticklabels([])

fig.suptitle("Violin Plotting Examples")
fig.subplots_adjust(hspace=0.4)
plt.show()
脚本的总运行时间: (0分1.108秒)
关键词:matplotlib代码示例,codex,python plot,pyplot Gallery generated by Sphinx-Gallery