注解
Click here 下载完整的示例代码
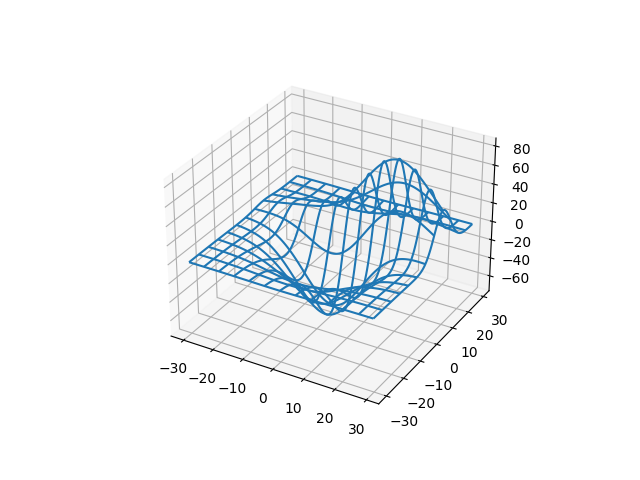
三维线框图
一个非常基本的线框图演示。
from mpl_toolkits.mplot3d import axes3d
import matplotlib.pyplot as plt


fig = plt.figure()
ax = fig.add_subplot(111, projection='3d')

# Grab some test data.
X, Y, Z = axes3d.get_test_data(0.05)

# Plot a basic wireframe.
ax.plot_wireframe(X, Y, Z, rstride=10, cstride=10)

plt.show()
关键词:matplotlib代码示例,codex,python plot,pyplot Gallery generated by Sphinx-Gallery