注解
Click here 下载完整的示例代码
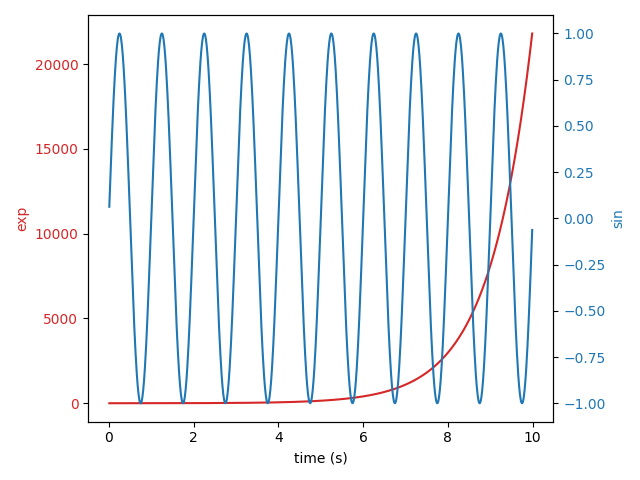
不同比例尺的图
两个图位于同一轴上,具有不同的左右比例。
诀窍是使用 两个不同的轴 共享相同的 x 轴。你可以单独使用 matplotlib.ticker 由于这两个轴是独立的,因此可以根据需要设置格式化程序和定位器。
这些轴是通过调用 Axes.twinx 方法。同样地, Axes.twiny 可用于生成共享 y 但有不同的顶部和底部刻度。
import numpy as np
import matplotlib.pyplot as plt

# Create some mock data
t = np.arange(0.01, 10.0, 0.01)
data1 = np.exp(t)
data2 = np.sin(2 * np.pi * t)

fig, ax1 = plt.subplots()

color = 'tab:red'
ax1.set_xlabel('time (s)')
ax1.set_ylabel('exp', color=color)
ax1.plot(t, data1, color=color)
ax1.tick_params(axis='y', labelcolor=color)

ax2 = ax1.twinx()  # instantiate a second axes that shares the same x-axis

color = 'tab:blue'
ax2.set_ylabel('sin', color=color)  # we already handled the x-label with ax1
ax2.plot(t, data2, color=color)
ax2.tick_params(axis='y', labelcolor=color)

fig.tight_layout()  # otherwise the right y-label is slightly clipped
plt.show()
工具书类
以下函数、方法、类和模块的使用如本例所示:
出:
<function _AxesBase.tick_params at 0x7faa00da68c8>
关键词:matplotlib代码示例,codex,python plot,pyplot Gallery generated by Sphinx-Gallery