注解
Click here 下载完整的示例代码
绘制分类变量
如何在matplotlib中使用分类变量。
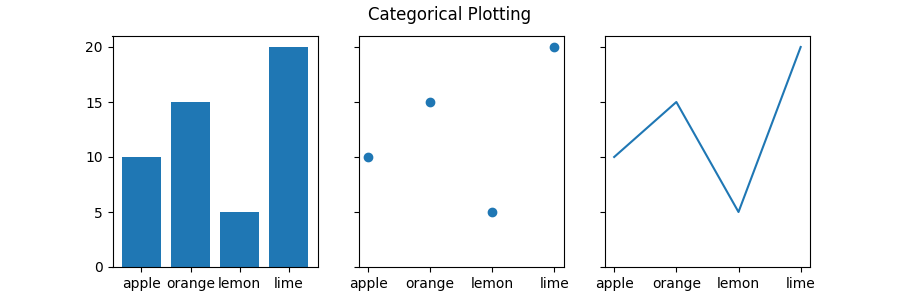
很多时候,您希望创建一个在matplotlib中使用分类变量的绘图。Matplotlib允许您将分类变量直接传递给许多绘图函数,我们将在下面演示。
import matplotlib.pyplot as plt

data = {'apple': 10, 'orange': 15, 'lemon': 5, 'lime': 20}
names = list(data.keys())
values = list(data.values())

fig, axs = plt.subplots(1, 3, figsize=(9, 3), sharey=True)
axs[0].bar(names, values)
axs[1].scatter(names, values)
axs[2].plot(names, values)
fig.suptitle('Categorical Plotting')
出:
Text(0.5, 0.98, 'Categorical Plotting')
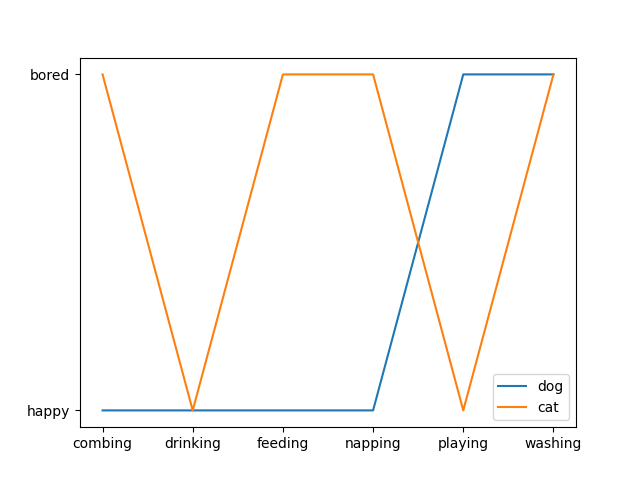
这对两个轴都有效:
cat = ["bored", "happy", "bored", "bored", "happy", "bored"]
dog = ["happy", "happy", "happy", "happy", "bored", "bored"]
activity = ["combing", "drinking", "feeding", "napping", "playing", "washing"]

fig, ax = plt.subplots()
ax.plot(activity, dog, label="dog")
ax.plot(activity, cat, label="cat")
ax.legend()

plt.show()
关键词:matplotlib代码示例,codex,python plot,pyplot Gallery generated by Sphinx-Gallery