注解
Click here 下载完整的示例代码
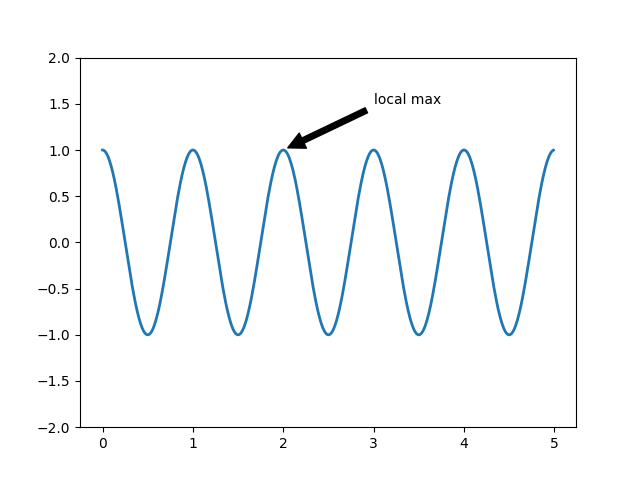
标注绘图
此示例演示如何使用指向所提供坐标的箭头注释绘图。我们将箭头的默认值修改为“收缩”。
有关注释功能的完整概述,请参见 annotation tutorial .
import numpy as np
import matplotlib.pyplot as plt

fig, ax = plt.subplots()

t = np.arange(0.0, 5.0, 0.01)
s = np.cos(2*np.pi*t)
line, = ax.plot(t, s, lw=2)

ax.annotate('local max', xy=(2, 1), xytext=(3, 1.5),
            arrowprops=dict(facecolor='black', shrink=0.05),
            )
ax.set_ylim(-2, 2)
plt.show()
工具书类
以下函数、方法、类和模块的使用如本例所示:
import matplotlib
matplotlib.axes.Axes.annotate
matplotlib.pyplot.annotate
出:
<function annotate at 0x7faa00cf8a60>
关键词:matplotlib代码示例,codex,python plot,pyplot Gallery generated by Sphinx-Gallery