注解
Click here 下载完整的示例代码
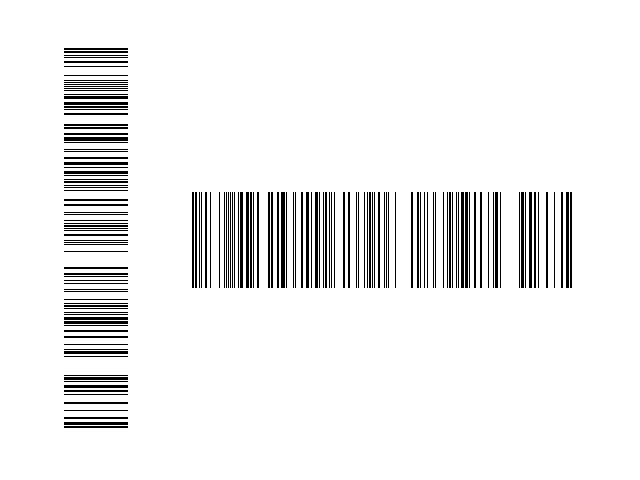
条形码演示
本演示演示如何生成一维图像或“条形码”。
import matplotlib.pyplot as plt
import numpy as np

# Fixing random state for reproducibility
np.random.seed(19680801)

# the bar
x = np.random.rand(500) > 0.7

barprops = dict(aspect='auto', cmap='binary', interpolation='nearest')

fig = plt.figure()

# a vertical barcode
ax1 = fig.add_axes([0.1, 0.1, 0.1, 0.8])
ax1.set_axis_off()
ax1.imshow(x.reshape((-1, 1)), **barprops)

# a horizontal barcode
ax2 = fig.add_axes([0.3, 0.4, 0.6, 0.2])
ax2.set_axis_off()
ax2.imshow(x.reshape((1, -1)), **barprops)

plt.show()
工具书类
本例中显示了以下函数、方法和类的使用:
import matplotlib
matplotlib.axes.Axes.imshow
matplotlib.pyplot.imshow
出:
<function imshow at 0x7faa00cfa9d8>
关键词:matplotlib代码示例,codex,python plot,pyplot Gallery generated by Sphinx-Gallery