注解
Click here 下载完整的示例代码
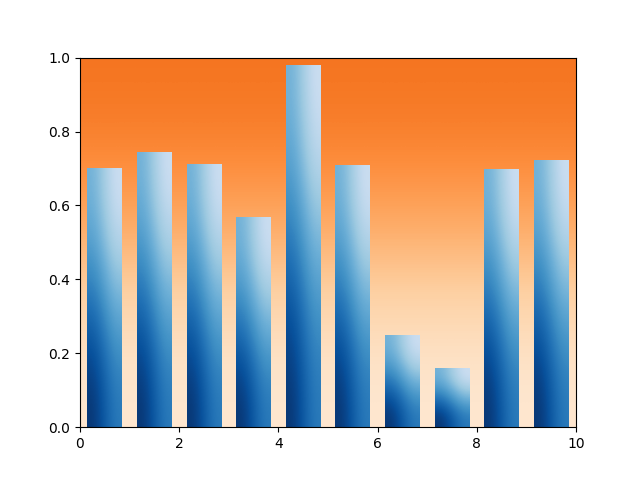
带渐变的条形图
Matplotlib本身不支持渐变。但是,我们可以用 AxesImage 大小和颜色都合适。
特别是,我们使用颜色映射来生成实际的颜色。然后在图像的角上定义基本值,并让双三次插值填充该区域就足够了。我们用单位向量定义梯度方向 v . 角点处的值由角向量的投影长度获得 v .
可以使用类似的方法为轴创建渐变背景。在这种情况下,使用轴坐标很有帮助 (extent=(0, 1, 0, 1), transform=ax.transAxes )独立于数据坐标。
import matplotlib.pyplot as plt
import numpy as np

np.random.seed(19680801)


def gradient_image(ax, extent, direction=0.3, cmap_range=(0, 1), **kwargs):
    """
    Draw a gradient image based on a colormap.

    Parameters
    ----------
    ax : Axes
        The axes to draw on.
    extent
        The extent of the image as (xmin, xmax, ymin, ymax).
        By default, this is in Axes coordinates but may be
        changed using the *transform* kwarg.
    direction : float
        The direction of the gradient. This is a number in
        range 0 (=vertical) to 1 (=horizontal).
    cmap_range : float, float
        The fraction (cmin, cmax) of the colormap that should be
        used for the gradient, where the complete colormap is (0, 1).
    **kwargs
        Other parameters are passed on to `.Axes.imshow()`.
        In particular useful is *cmap*.
    """
    phi = direction * np.pi / 2
    v = np.array([np.cos(phi), np.sin(phi)])
    X = np.array([[v @ [1, 0], v @ [1, 1]],
                  [v @ [0, 0], v @ [0, 1]]])
    a, b = cmap_range
    X = a + (b - a) / X.max() * X
    im = ax.imshow(X, extent=extent, interpolation='bicubic',
                   vmin=0, vmax=1, **kwargs)
    return im


def gradient_bar(ax, x, y, width=0.5, bottom=0):
    for left, top in zip(x, y):
        right = left + width
        gradient_image(ax, extent=(left, right, bottom, top),
                       cmap=plt.cm.Blues_r, cmap_range=(0, 0.8))


xmin, xmax = xlim = 0, 10
ymin, ymax = ylim = 0, 1

fig, ax = plt.subplots()
ax.set(xlim=xlim, ylim=ylim, autoscale_on=False)

# background image
gradient_image(ax, direction=0, extent=(0, 1, 0, 1), transform=ax.transAxes,
               cmap=plt.cm.Oranges, cmap_range=(0.1, 0.6))

N = 10
x = np.arange(N) + 0.15
y = np.random.rand(N)
gradient_bar(ax, x, y, width=0.7)
ax.set_aspect('auto')
plt.show()
关键词:matplotlib代码示例,codex,python plot,pyplot Gallery generated by Sphinx-Gallery