注解
Click here 下载完整的示例代码
高级quiver和quiverkey函数
演示一些更高级的选项 quiver . 有关简单示例,请参阅 震颤简单演示 .
注意:绘图自动缩放不考虑箭头,因此边界上的箭头可能超出图片范围。这不是一个很容易解决的问题。建议的解决方法是在这种情况下手动设置轴限制。
fig1, ax1 = plt.subplots()
ax1.set_title('Arrows scale with plot width, not view')
Q = ax1.quiver(X, Y, U, V, units='width')
qk = ax1.quiverkey(Q, 0.9, 0.9, 2, r'$2 \frac{m}{s}$', labelpos='E',
                   coordinates='figure')
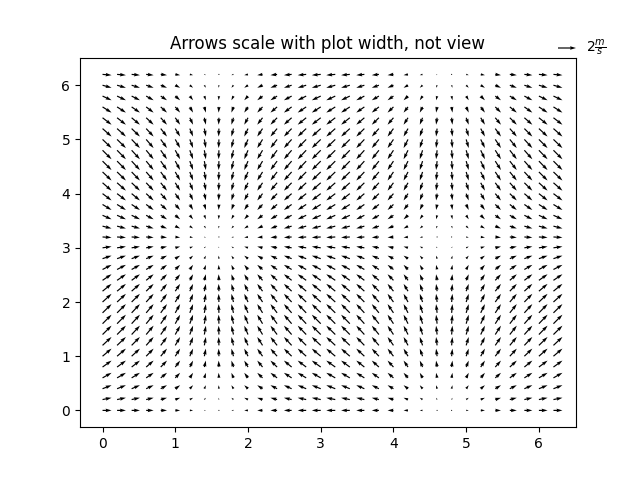
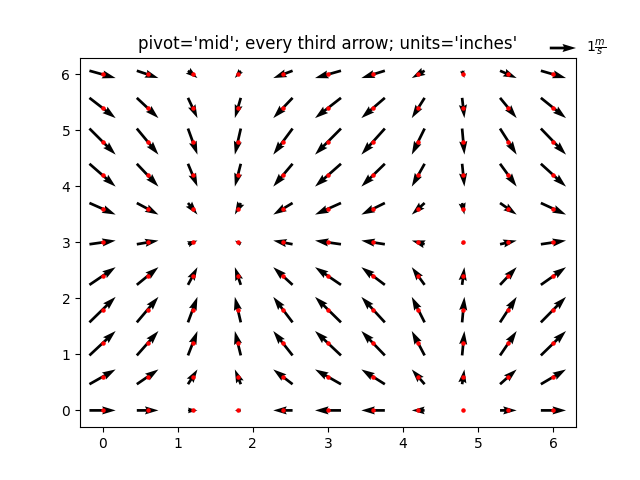
fig2, ax2 = plt.subplots()
ax2.set_title("pivot='mid'; every third arrow; units='inches'")
Q = ax2.quiver(X[::3, ::3], Y[::3, ::3], U[::3, ::3], V[::3, ::3],
               pivot='mid', units='inches')
qk = ax2.quiverkey(Q, 0.9, 0.9, 1, r'$1 \frac{m}{s}$', labelpos='E',
                   coordinates='figure')
ax2.scatter(X[::3, ::3], Y[::3, ::3], color='r', s=5)
出:
<matplotlib.collections.PathCollection object at 0x7faa0a8e0e10>
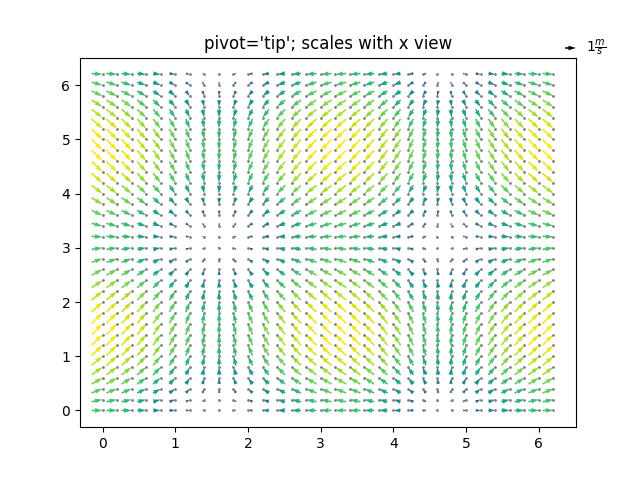
fig3, ax3 = plt.subplots()
ax3.set_title("pivot='tip'; scales with x view")
M = np.hypot(U, V)
Q = ax3.quiver(X, Y, U, V, M, units='x', pivot='tip', width=0.022,
               scale=1 / 0.15)
qk = ax3.quiverkey(Q, 0.9, 0.9, 1, r'$1 \frac{m}{s}$', labelpos='E',
                   coordinates='figure')
ax3.scatter(X, Y, color='0.5', s=1)

plt.show()
工具书类
本例中显示了以下函数和方法的使用:
出:
<function quiverkey at 0x7faa00cfd2f0>
脚本的总运行时间: (0分2.210秒)
关键词:matplotlib代码示例,codex,python plot,pyplot Gallery generated by Sphinx-Gallery