注解
Click here 下载完整的示例代码
堆栈图和流图
堆叠图
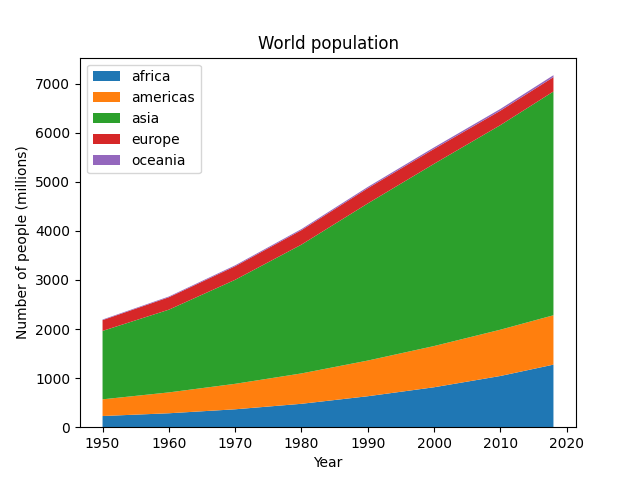
Stackplots将多个数据集绘制为垂直堆叠的区域。当单独的数据值以及它们的累积值都很重要时,这一点很有用。
import numpy as np
import matplotlib.pyplot as plt

# data from United Nations World Population Prospects (Revision 2019)
# https://population.un.org/wpp/, license: CC BY 3.0 IGO
year = [1950, 1960, 1970, 1980, 1990, 2000, 2010, 2018]
population_by_continent = {
    'africa': [228, 284, 365, 477, 631, 814, 1044, 1275],
    'americas': [340, 425, 519, 619, 727, 840, 943, 1006],
    'asia': [1394, 1686, 2120, 2625, 3202, 3714, 4169, 4560],
    'europe': [220, 253, 276, 295, 310, 303, 294, 293],
    'oceania': [12, 15, 19, 22, 26, 31, 36, 39],
}

fig, ax = plt.subplots()
ax.stackplot(year, population_by_continent.values(),
             labels=population_by_continent.keys())
ax.legend(loc='upper left')
ax.set_title('World population')
ax.set_xlabel('Year')
ax.set_ylabel('Number of people (millions)')

plt.show()
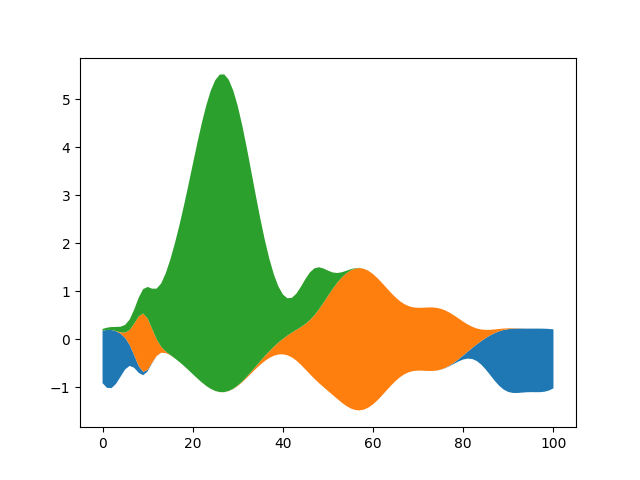
流图
使用 基线 参数,可以将基线为0的普通堆积面积图转换为流图。
# Fixing random state for reproducibility
np.random.seed(19680801)


def gaussian_mixture(x, n=5):
    """Return a random mixture of *n* Gaussians, evaluated at positions *x*."""
    def add_random_gaussian(a):
        amplitude = 1 / (.1 + np.random.random())
        dx = x[-1] - x[0]
        x0 = (2 * np.random.random() - .5) * dx
        z = 10 / (.1 + np.random.random()) / dx
        a += amplitude * np.exp(-(z * (x - x0))**2)
    a = np.zeros_like(x)
    for j in range(n):
        add_random_gaussian(a)
    return a


x = np.linspace(0, 100, 101)
ys = [gaussian_mixture(x) for _ in range(3)]

fig, ax = plt.subplots()
ax.stackplot(x, ys, baseline='wiggle')
plt.show()
关键词:matplotlib代码示例,codex,python plot,pyplot Gallery generated by Sphinx-Gallery