注解
Click here 下载完整的示例代码
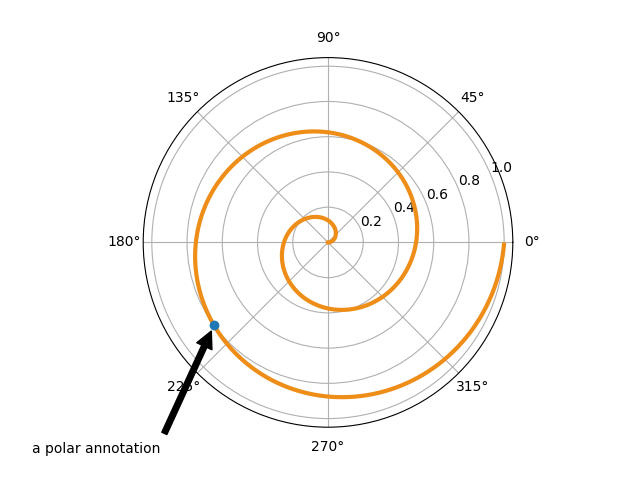
注释极坐标
此示例演示如何在极坐标图上创建注释。
有关注释功能的完整概述,请参见 annotation tutorial .
import numpy as np
import matplotlib.pyplot as plt

fig = plt.figure()
ax = fig.add_subplot(111, polar=True)
r = np.arange(0, 1, 0.001)
theta = 2 * 2*np.pi * r
line, = ax.plot(theta, r, color='#ee8d18', lw=3)

ind = 800
thisr, thistheta = r[ind], theta[ind]
ax.plot([thistheta], [thisr], 'o')
ax.annotate('a polar annotation',
            xy=(thistheta, thisr),  # theta, radius
            xytext=(0.05, 0.05),    # fraction, fraction
            textcoords='figure fraction',
            arrowprops=dict(facecolor='black', shrink=0.05),
            horizontalalignment='left',
            verticalalignment='bottom',
            )
plt.show()
工具书类
以下函数、方法、类和模块的使用如本例所示:
出:
<function annotate at 0x7faa00cf8a60>
关键词:matplotlib代码示例,codex,python plot,pyplot Gallery generated by Sphinx-Gallery