注解
Click here 下载完整的示例代码
颜色映射规范化
演示如何使用norm以非线性方式将颜色映射到数据上。
import numpy as np
import matplotlib.pyplot as plt
import matplotlib.colors as colors
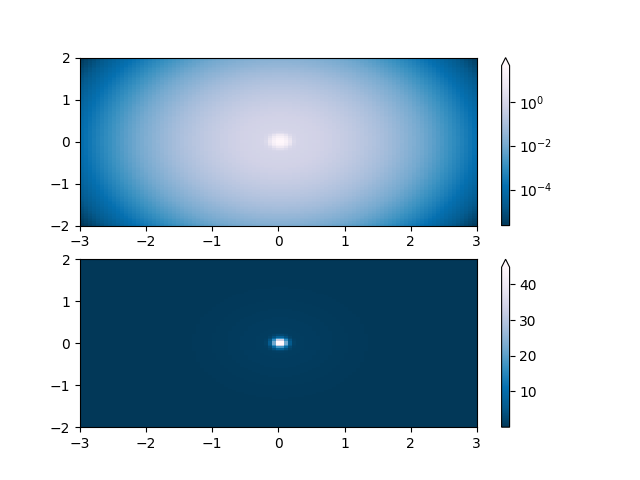
lognorm:用norm代替pcolor log10(z1),您可以使用具有指数标签的颜色条。
N = 100
X, Y = np.mgrid[-3:3:complex(0, N), -2:2:complex(0, N)]

# A low hump with a spike coming out of the top.  Needs to have
# z/colour axis on a log scale so we see both hump and spike.  linear
# scale only shows the spike.

Z1 = np.exp(-X**2 - Y**2)
Z2 = np.exp(-(X * 10)**2 - (Y * 10)**2)
Z = Z1 + 50 * Z2

fig, ax = plt.subplots(2, 1)

pcm = ax[0].pcolor(X, Y, Z,
                   norm=colors.LogNorm(vmin=Z.min(), vmax=Z.max()),
                   cmap='PuBu_r')
fig.colorbar(pcm, ax=ax[0], extend='max')

pcm = ax[1].pcolor(X, Y, Z, cmap='PuBu_r')
fig.colorbar(pcm, ax=ax[1], extend='max')
出:
/pb1/rst_repos/git/matplotlib/examples/userdemo/colormap_normalizations.py:32: MatplotlibDeprecationWarning: shading='flat' when X and Y have the same dimensions as C is deprecated since 3.3.  Either specify the corners of the quadrilaterals with X and Y, or pass shading='auto', 'nearest' or 'gouraud', or set rcParams['pcolor.shading'].  This will become an error two minor releases later.
  cmap='PuBu_r')
/pb1/rst_repos/git/matplotlib/examples/userdemo/colormap_normalizations.py:35: MatplotlibDeprecationWarning: shading='flat' when X and Y have the same dimensions as C is deprecated since 3.3.  Either specify the corners of the quadrilaterals with X and Y, or pass shading='auto', 'nearest' or 'gouraud', or set rcParams['pcolor.shading'].  This will become an error two minor releases later.
  pcm = ax[1].pcolor(X, Y, Z, cmap='PuBu_r')

<matplotlib.colorbar.Colorbar object at 0x7fa9fc847e80>
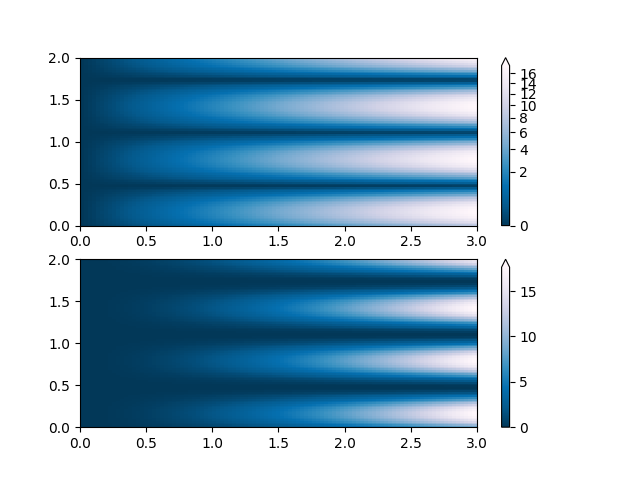
幂律:这里x的幂律趋势部分掩盖了y的正弦波。我们可以用幂律来消除幂律。
X, Y = np.mgrid[0:3:complex(0, N), 0:2:complex(0, N)]
Z1 = (1 + np.sin(Y * 10.)) * X**2

fig, ax = plt.subplots(2, 1)

pcm = ax[0].pcolormesh(X, Y, Z1, norm=colors.PowerNorm(gamma=1. / 2.),
                       cmap='PuBu_r')
fig.colorbar(pcm, ax=ax[0], extend='max')

pcm = ax[1].pcolormesh(X, Y, Z1, cmap='PuBu_r')
fig.colorbar(pcm, ax=ax[1], extend='max')
出:
/pb1/rst_repos/git/matplotlib/examples/userdemo/colormap_normalizations.py:49: MatplotlibDeprecationWarning: shading='flat' when X and Y have the same dimensions as C is deprecated since 3.3.  Either specify the corners of the quadrilaterals with X and Y, or pass shading='auto', 'nearest' or 'gouraud', or set rcParams['pcolor.shading'].  This will become an error two minor releases later.
  cmap='PuBu_r')
/pb1/rst_repos/git/matplotlib/examples/userdemo/colormap_normalizations.py:52: MatplotlibDeprecationWarning: shading='flat' when X and Y have the same dimensions as C is deprecated since 3.3.  Either specify the corners of the quadrilaterals with X and Y, or pass shading='auto', 'nearest' or 'gouraud', or set rcParams['pcolor.shading'].  This will become an error two minor releases later.
  pcm = ax[1].pcolormesh(X, Y, Z1, cmap='PuBu_r')

<matplotlib.colorbar.Colorbar object at 0x7fa9fcb5e630>
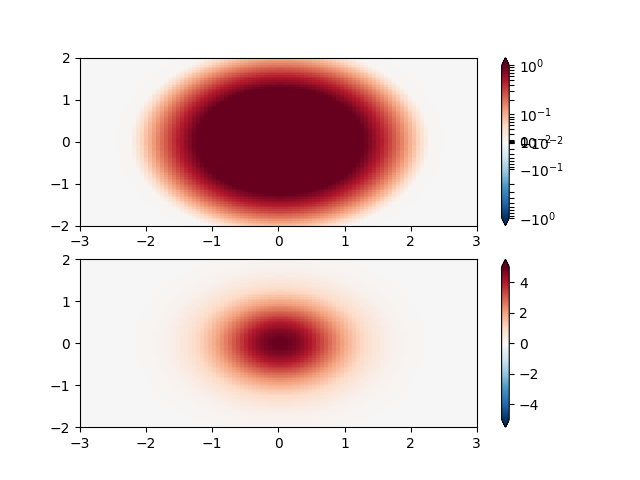
对称模:两个驼峰,一个为负,一个为正,正幅度为振幅的5倍。线性的,你看不到负驼峰的细节。这里我们分别对数缩放正数据和负数据。
请注意,颜色条标签看起来不是很好。
X, Y = np.mgrid[-3:3:complex(0, N), -2:2:complex(0, N)]
Z1 = 5 * np.exp(-X**2 - Y**2)
Z2 = np.exp(-(X - 1)**2 - (Y - 1)**2)
Z = (Z1 - Z2) * 2

fig, ax = plt.subplots(2, 1)

pcm = ax[0].pcolormesh(X, Y, Z1,
                       norm=colors.SymLogNorm(linthresh=0.03, linscale=0.03,
                                              vmin=-1.0, vmax=1.0, base=10),
                       cmap='RdBu_r')
fig.colorbar(pcm, ax=ax[0], extend='both')

pcm = ax[1].pcolormesh(X, Y, Z1, cmap='RdBu_r', vmin=-np.max(Z1))
fig.colorbar(pcm, ax=ax[1], extend='both')
出:
/pb1/rst_repos/git/matplotlib/examples/userdemo/colormap_normalizations.py:73: MatplotlibDeprecationWarning: shading='flat' when X and Y have the same dimensions as C is deprecated since 3.3.  Either specify the corners of the quadrilaterals with X and Y, or pass shading='auto', 'nearest' or 'gouraud', or set rcParams['pcolor.shading'].  This will become an error two minor releases later.
  cmap='RdBu_r')
/pb1/rst_repos/git/matplotlib/examples/userdemo/colormap_normalizations.py:76: MatplotlibDeprecationWarning: shading='flat' when X and Y have the same dimensions as C is deprecated since 3.3.  Either specify the corners of the quadrilaterals with X and Y, or pass shading='auto', 'nearest' or 'gouraud', or set rcParams['pcolor.shading'].  This will become an error two minor releases later.
  pcm = ax[1].pcolormesh(X, Y, Z1, cmap='RdBu_r', vmin=-np.max(Z1))

<matplotlib.colorbar.Colorbar object at 0x7fa9fc7dd3c8>
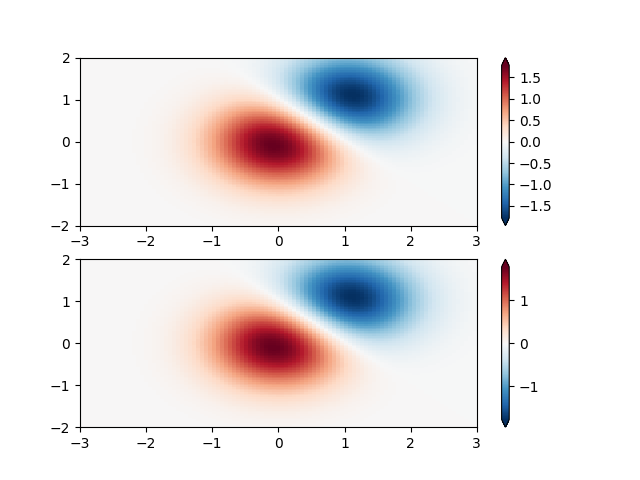
自定义规范:具有自定义规范化的示例。这个示例使用上面的示例,并以不同于正的方式规范化负数据。
X, Y = np.mgrid[-3:3:complex(0, N), -2:2:complex(0, N)]
Z1 = np.exp(-X**2 - Y**2)
Z2 = np.exp(-(X - 1)**2 - (Y - 1)**2)
Z = (Z1 - Z2) * 2

# Example of making your own norm.  Also see matplotlib.colors.
# From Joe Kington: This one gives two different linear ramps:


class MidpointNormalize(colors.Normalize):
    def __init__(self, vmin=None, vmax=None, midpoint=None, clip=False):
        self.midpoint = midpoint
        colors.Normalize.__init__(self, vmin, vmax, clip)

    def __call__(self, value, clip=None):
        # I'm ignoring masked values and all kinds of edge cases to make a
        # simple example...
        x, y = [self.vmin, self.midpoint, self.vmax], [0, 0.5, 1]
        return np.ma.masked_array(np.interp(value, x, y))


#####
fig, ax = plt.subplots(2, 1)

pcm = ax[0].pcolormesh(X, Y, Z,
                       norm=MidpointNormalize(midpoint=0.),
                       cmap='RdBu_r')
fig.colorbar(pcm, ax=ax[0], extend='both')

pcm = ax[1].pcolormesh(X, Y, Z, cmap='RdBu_r', vmin=-np.max(Z))
fig.colorbar(pcm, ax=ax[1], extend='both')
出:
/pb1/rst_repos/git/matplotlib/examples/userdemo/colormap_normalizations.py:111: MatplotlibDeprecationWarning: shading='flat' when X and Y have the same dimensions as C is deprecated since 3.3.  Either specify the corners of the quadrilaterals with X and Y, or pass shading='auto', 'nearest' or 'gouraud', or set rcParams['pcolor.shading'].  This will become an error two minor releases later.
  cmap='RdBu_r')
/pb1/rst_repos/git/matplotlib/examples/userdemo/colormap_normalizations.py:114: MatplotlibDeprecationWarning: shading='flat' when X and Y have the same dimensions as C is deprecated since 3.3.  Either specify the corners of the quadrilaterals with X and Y, or pass shading='auto', 'nearest' or 'gouraud', or set rcParams['pcolor.shading'].  This will become an error two minor releases later.
  pcm = ax[1].pcolormesh(X, Y, Z, cmap='RdBu_r', vmin=-np.max(Z))

<matplotlib.colorbar.Colorbar object at 0x7fa9e4fa3240>
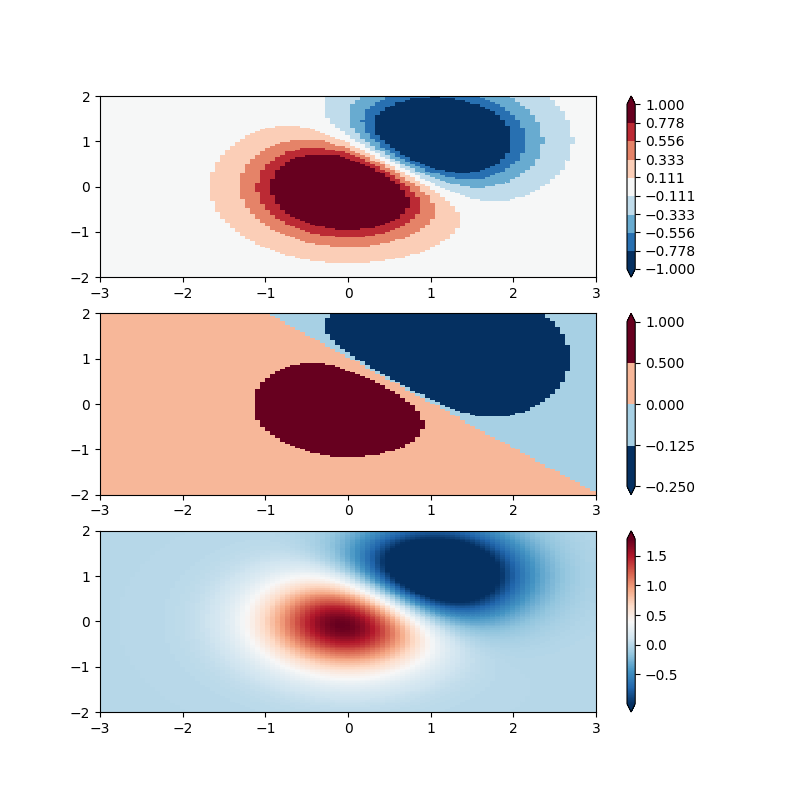
边界形式:对于这一种,你为你的颜色提供边界,并且norm将第一种颜色放在第一对之间,第二种颜色放在第二对之间,等等。
fig, ax = plt.subplots(3, 1, figsize=(8, 8))
ax = ax.flatten()
# even bounds gives a contour-like effect
bounds = np.linspace(-1, 1, 10)
norm = colors.BoundaryNorm(boundaries=bounds, ncolors=256)
pcm = ax[0].pcolormesh(X, Y, Z,
                       norm=norm,
                       cmap='RdBu_r')
fig.colorbar(pcm, ax=ax[0], extend='both', orientation='vertical')

# uneven bounds changes the colormapping:
bounds = np.array([-0.25, -0.125, 0, 0.5, 1])
norm = colors.BoundaryNorm(boundaries=bounds, ncolors=256)
pcm = ax[1].pcolormesh(X, Y, Z, norm=norm, cmap='RdBu_r')
fig.colorbar(pcm, ax=ax[1], extend='both', orientation='vertical')

pcm = ax[2].pcolormesh(X, Y, Z, cmap='RdBu_r', vmin=-np.max(Z1))
fig.colorbar(pcm, ax=ax[2], extend='both', orientation='vertical')

plt.show()
出:
/pb1/rst_repos/git/matplotlib/examples/userdemo/colormap_normalizations.py:129: MatplotlibDeprecationWarning: shading='flat' when X and Y have the same dimensions as C is deprecated since 3.3.  Either specify the corners of the quadrilaterals with X and Y, or pass shading='auto', 'nearest' or 'gouraud', or set rcParams['pcolor.shading'].  This will become an error two minor releases later.
  cmap='RdBu_r')
/pb1/rst_repos/git/matplotlib/examples/userdemo/colormap_normalizations.py:135: MatplotlibDeprecationWarning: shading='flat' when X and Y have the same dimensions as C is deprecated since 3.3.  Either specify the corners of the quadrilaterals with X and Y, or pass shading='auto', 'nearest' or 'gouraud', or set rcParams['pcolor.shading'].  This will become an error two minor releases later.
  pcm = ax[1].pcolormesh(X, Y, Z, norm=norm, cmap='RdBu_r')
/pb1/rst_repos/git/matplotlib/examples/userdemo/colormap_normalizations.py:138: MatplotlibDeprecationWarning: shading='flat' when X and Y have the same dimensions as C is deprecated since 3.3.  Either specify the corners of the quadrilaterals with X and Y, or pass shading='auto', 'nearest' or 'gouraud', or set rcParams['pcolor.shading'].  This will become an error two minor releases later.
  pcm = ax[2].pcolormesh(X, Y, Z, cmap='RdBu_r', vmin=-np.max(Z1))
脚本的总运行时间: (360.3分)
关键词:matplotlib代码示例,codex,python plot,pyplot Gallery generated by Sphinx-Gallery