注解
Click here 下载完整的示例代码
数学文本图像作为numpy数组
用 Latex 线制作图像。
import matplotlib.mathtext as mathtext
import matplotlib.pyplot as plt
parser = mathtext.MathTextParser("Bitmap")
parser.to_png('test2.png',
r'$\left[\left\lfloor\frac{5}{\frac{\left(3\right)}{4}} '
r'y\right)\right]$', color='green', fontsize=14, dpi=100)
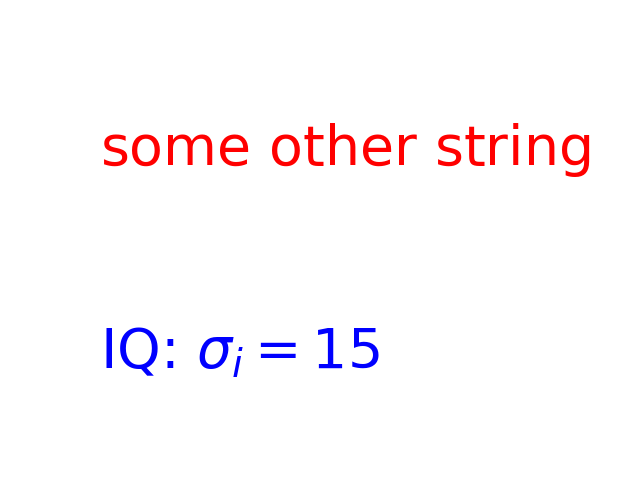
rgba1, depth1 = parser.to_rgba(
r'IQ: $\sigma_i=15$', color='blue', fontsize=20, dpi=200)
rgba2, depth2 = parser.to_rgba(
r'some other string', color='red', fontsize=20, dpi=200)
fig = plt.figure()
fig.figimage(rgba1, 100, 100)
fig.figimage(rgba2, 100, 300)
plt.show()
工具书类
以下函数、方法、类和模块的使用如本例所示:
出:
<function Figure.figimage at 0x7faa00d2ec80>
关键词:matplotlib代码示例,codex,python plot,pyplot Gallery generated by Sphinx-Gallery