注解
Click here 下载完整的示例代码
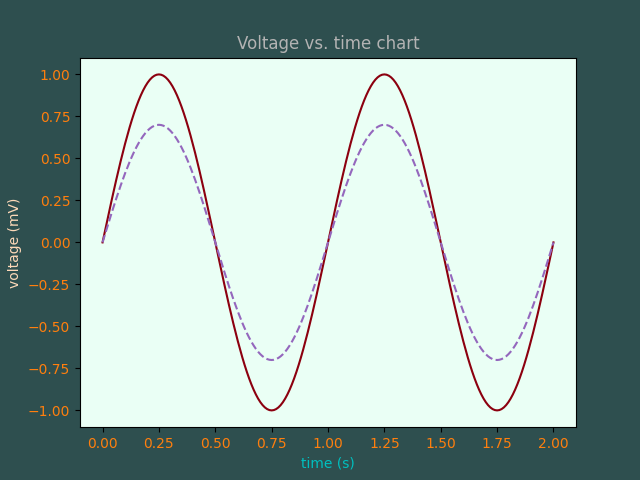
色彩演示
matplotlib识别以下格式以指定颜色:
- 中浮点值的rgb或rgba元组
[0, 1](例如)(0.1, 0.2, 0.5)或(0.1, 0.2, 0.5, 0.3))rgba是红色、绿色、蓝色、alpha的缩写; - 十六进制rgb或rgb a字符串(例如,
'#0F0F0F'或'#0F0F0F0F'; - 一种简写的十六进制RGB或RGBA字符串,相当于通过复制每个字符获得的十六进制RGB或RGBA字符串(例如。,
'#abc',相当于'#aabbcc'或'#abcd',相当于'#aabbccdd'; - 浮点值的字符串表示形式
[0, 1]包括灰级(例如,'0.5'; - 单个字母串,即
{{'b', 'g', 'r', 'c', 'm', 'y', 'k', 'w'}},是蓝色、绿色、红色、青色、品红、黄色、黑色和白色阴影的简写符号; - 一个x11/css4(“html”)颜色名称,例如
"blue"; - 名字来自 xkcd color survey 前缀
'xkcd:'(例如,'xkcd:sky blue'; - “CN”颜色规格,即
'C'后跟一个数字,它是默认属性循环的索引 (rcParams["axes.prop_cycle"](default:cycler('color', ['#1f77b4', '#ff7f0e', '#2ca02c', '#d62728', '#9467bd', '#8c564b', '#e377c2', '#7f7f7f', '#bcbd22', '#17becf'])) );索引将在渲染时发生,如果循环不包括颜色,则默认为黑色。 - 什么之中的一个
{{'tab:blue', 'tab:orange', 'tab:green', 'tab:red', 'tab:purple', 'tab:brown', 'tab:pink', 'tab:gray', 'tab:olive', 'tab:cyan'}}这是“tab10”分类调色板中的Tableau颜色(默认颜色循环);
有关matplotlib中颜色的详细信息,请参见
- 这个 指定颜色 辅导的;
- 这个
matplotlib.colors应用程序编程接口; - 这个 命名颜色列表 例子。
import matplotlib.pyplot as plt
import numpy as np

t = np.linspace(0.0, 2.0, 201)
s = np.sin(2 * np.pi * t)

# 1) RGB tuple:
fig, ax = plt.subplots(facecolor=(.18, .31, .31))
# 2) hex string:
ax.set_facecolor('#eafff5')
# 3) gray level string:
ax.set_title('Voltage vs. time chart', color='0.7')
# 4) single letter color string
ax.set_xlabel('time (s)', color='c')
# 5) a named color:
ax.set_ylabel('voltage (mV)', color='peachpuff')
# 6) a named xkcd color:
ax.plot(t, s, 'xkcd:crimson')
# 7) Cn notation:
ax.plot(t, .7*s, color='C4', linestyle='--')
# 8) tab notation:
ax.tick_params(labelcolor='tab:orange')


plt.show()
工具书类
以下函数、方法、类和模块的使用如本例所示:
出:
<function _AxesBase.tick_params at 0x7faa00da68c8>
关键词:matplotlib代码示例,codex,python plot,pyplot Gallery generated by Sphinx-Gallery