注解
Click here 下载完整的示例代码
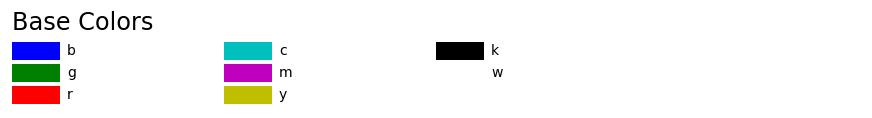
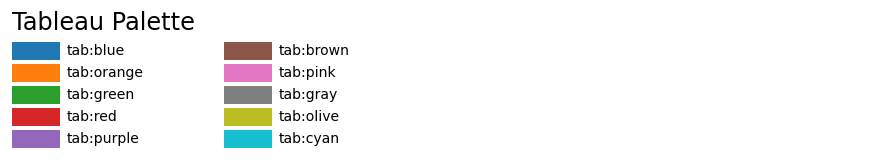
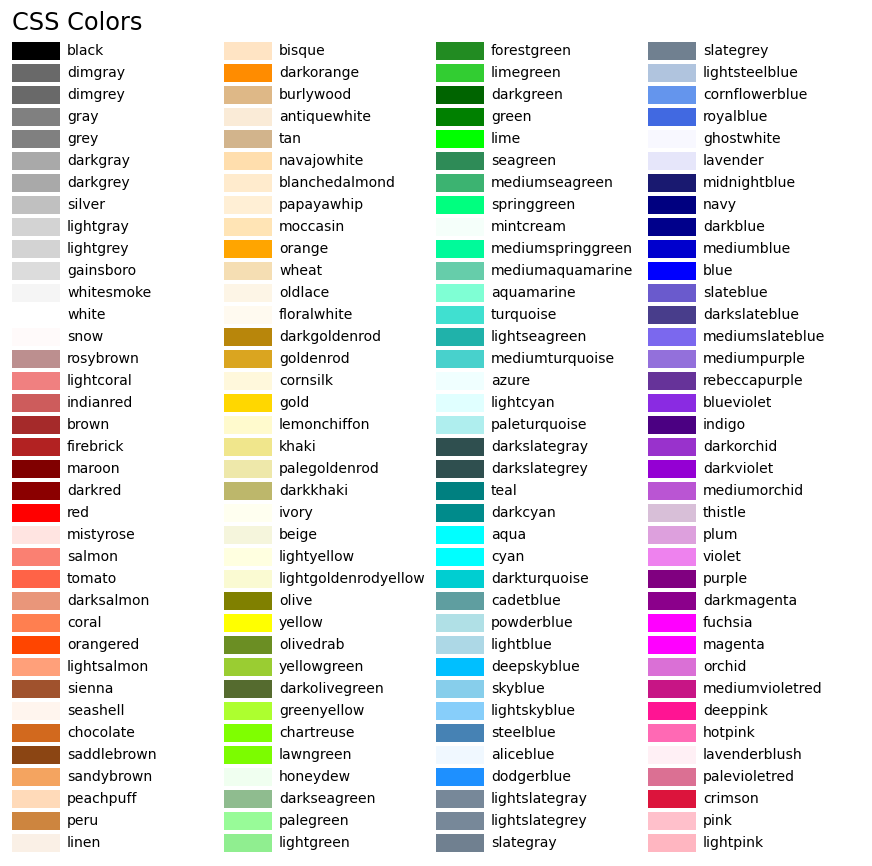
命名颜色列表
这将绘制matplotlib中支持的命名颜色列表。注意 xkcd colors 也支持,但为了简洁起见,此处未列出。
有关matplotlib中颜色的详细信息,请参见
- 这个 指定颜色 辅导的;
- 这个
matplotlib.colors应用程序编程接口; - 这个 色彩演示 .
from matplotlib.patches import Rectangle
import matplotlib.pyplot as plt
import matplotlib.colors as mcolors


def plot_colortable(colors, title, sort_colors=True, emptycols=0):

    cell_width = 212
    cell_height = 22
    swatch_width = 48
    margin = 12
    topmargin = 40

    # Sort colors by hue, saturation, value and name.
    if sort_colors is True:
        by_hsv = sorted((tuple(mcolors.rgb_to_hsv(mcolors.to_rgb(color))),
                         name)
                        for name, color in colors.items())
        names = [name for hsv, name in by_hsv]
    else:
        names = list(colors)

    n = len(names)
    ncols = 4 - emptycols
    nrows = n // ncols + int(n % ncols > 0)

    width = cell_width * 4 + 2 * margin
    height = cell_height * nrows + margin + topmargin
    dpi = 72

    fig, ax = plt.subplots(figsize=(width / dpi, height / dpi), dpi=dpi)
    fig.subplots_adjust(margin/width, margin/height,
                        (width-margin)/width, (height-topmargin)/height)
    ax.set_xlim(0, cell_width * 4)
    ax.set_ylim(cell_height * (nrows-0.5), -cell_height/2.)
    ax.yaxis.set_visible(False)
    ax.xaxis.set_visible(False)
    ax.set_axis_off()
    ax.set_title(title, fontsize=24, loc="left", pad=10)

    for i, name in enumerate(names):
        row = i % nrows
        col = i // nrows
        y = row * cell_height

        swatch_start_x = cell_width * col
        text_pos_x = cell_width * col + swatch_width + 7

        ax.text(text_pos_x, y, name, fontsize=14,
                horizontalalignment='left',
                verticalalignment='center')

        ax.add_patch(
            Rectangle(xy=(swatch_start_x, y-9), width=swatch_width,
                      height=18, facecolor=colors[name])
        )

    return fig

plot_colortable(mcolors.BASE_COLORS, "Base Colors",
                sort_colors=False, emptycols=1)
plot_colortable(mcolors.TABLEAU_COLORS, "Tableau Palette",
                sort_colors=False, emptycols=2)

plot_colortable(mcolors.CSS4_COLORS, "CSS Colors")

# Optionally plot the XKCD colors (Caution: will produce large figure)
#xkcd_fig = plot_colortable(mcolors.XKCD_COLORS, "XKCD Colors")
#xkcd_fig.savefig("XKCD_Colors.png")

plt.show()
工具书类
以下函数、方法、类和模块的使用如本例所示:
脚本的总运行时间: (0分1.735秒)
关键词:matplotlib代码示例,codex,python plot,pyplot Gallery generated by Sphinx-Gallery