注解
Click here 下载完整的示例代码
轮廓标签演示
举例说明一些可以用轮廓标签做的更高级的事情。
也见 contour demo example .
import matplotlib
import numpy as np
import matplotlib.ticker as ticker
import matplotlib.pyplot as plt
定义我们的表面
根据曼纽尔·梅茨的建议,使用创造性的浮动类制作轮廓标签。
# Define a class that forces representation of float to look a certain way
# This remove trailing zero so '1.0' becomes '1'


class nf(float):
    def __repr__(self):
        s = f'{self:.1f}'
        return f'{self:.0f}' if s[-1] == '0' else s


# Basic contour plot
fig, ax = plt.subplots()
CS = ax.contour(X, Y, Z)

# Recast levels to new class
CS.levels = [nf(val) for val in CS.levels]

# Label levels with specially formatted floats
if plt.rcParams["text.usetex"]:
    fmt = r'%r \%%'
else:
    fmt = '%r %%'

ax.clabel(CS, CS.levels, inline=True, fmt=fmt, fontsize=10)

出:
<a list of 7 text.Text objects>
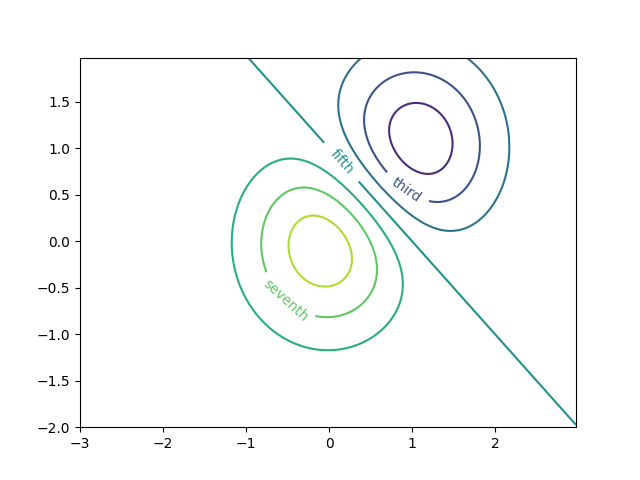
使用字典用任意字符串标记轮廓
fig1, ax1 = plt.subplots()

# Basic contour plot
CS1 = ax1.contour(X, Y, Z)

fmt = {}
strs = ['first', 'second', 'third', 'fourth', 'fifth', 'sixth', 'seventh']
for l, s in zip(CS1.levels, strs):
    fmt[l] = s

# Label every other level using strings
ax1.clabel(CS1, CS1.levels[::2], inline=True, fmt=fmt, fontsize=10)
出:
<a list of 3 text.Text objects>
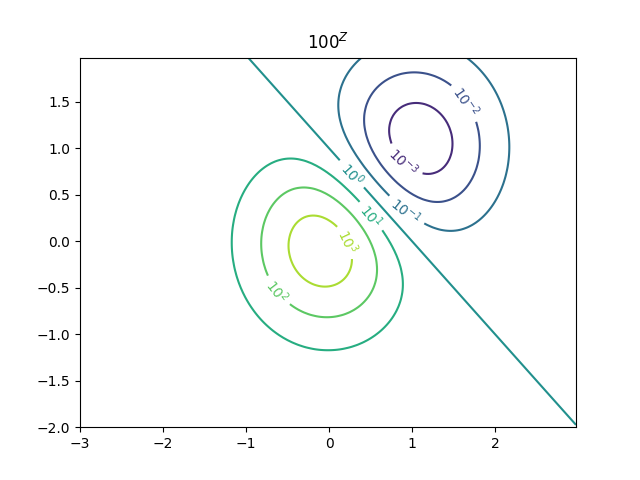
使用格式化程序
fig2, ax2 = plt.subplots()

CS2 = ax2.contour(X, Y, 100**Z, locator=plt.LogLocator())
fmt = ticker.LogFormatterMathtext()
fmt.create_dummy_axis()
ax2.clabel(CS2, CS2.levels, fmt=fmt)
ax2.set_title("$100^Z$")

plt.show()
工具书类
本例中显示了以下函数、方法和类的使用:
出:
<function TickHelper.create_dummy_axis at 0x7faa168c69d8>
脚本的总运行时间: (0分1.700秒)
关键词:matplotlib代码示例,codex,python plot,pyplot Gallery generated by Sphinx-Gallery