注解
Click here 下载完整的示例代码
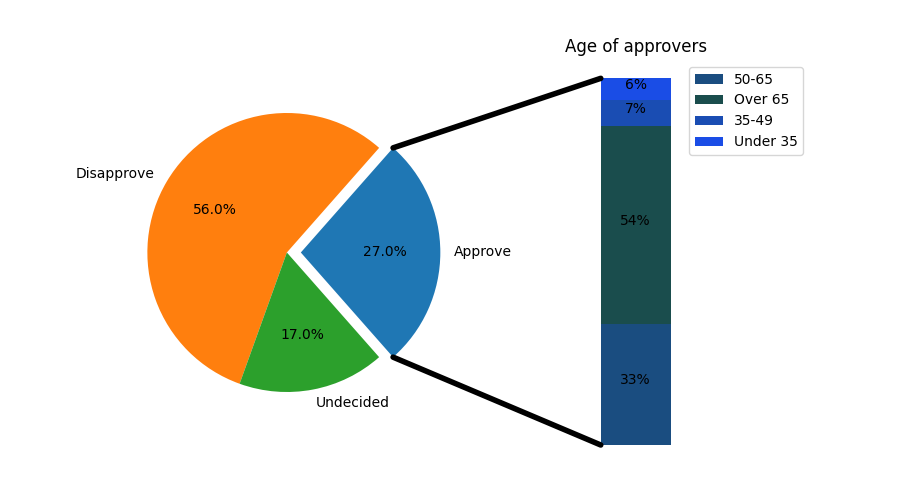
馅饼棒
制作一个“条形饼图”,其中饼图的第一个切片被“分解”成条形图,并进一步分解该切片的特性。该示例演示如何使用具有多组轴的图,以及如何使用轴修补程序列表添加两个连接修补程序来链接子批次图。
import matplotlib.pyplot as plt
from matplotlib.patches import ConnectionPatch
import numpy as np

# make figure and assign axis objects
fig = plt.figure(figsize=(9, 5))
ax1 = fig.add_subplot(121)
ax2 = fig.add_subplot(122)
fig.subplots_adjust(wspace=0)

# pie chart parameters
ratios = [.27, .56, .17]
labels = ['Approve', 'Disapprove', 'Undecided']
explode = [0.1, 0, 0]
# rotate so that first wedge is split by the x-axis
angle = -180 * ratios[0]
ax1.pie(ratios, autopct='%1.1f%%', startangle=angle,
        labels=labels, explode=explode)

# bar chart parameters

xpos = 0
bottom = 0
ratios = [.33, .54, .07, .06]
width = .2
colors = [[.1, .3, .5], [.1, .3, .3], [.1, .3, .7], [.1, .3, .9]]

for j in range(len(ratios)):
    height = ratios[j]
    ax2.bar(xpos, height, width, bottom=bottom, color=colors[j])
    ypos = bottom + ax2.patches[j].get_height() / 2
    bottom += height
    ax2.text(xpos, ypos, "%d%%" % (ax2.patches[j].get_height() * 100),
             ha='center')

ax2.set_title('Age of approvers')
ax2.legend(('50-65', 'Over 65', '35-49', 'Under 35'))
ax2.axis('off')
ax2.set_xlim(- 2.5 * width, 2.5 * width)

# use ConnectionPatch to draw lines between the two plots
# get the wedge data
theta1, theta2 = ax1.patches[0].theta1, ax1.patches[0].theta2
center, r = ax1.patches[0].center, ax1.patches[0].r
bar_height = sum([item.get_height() for item in ax2.patches])

# draw top connecting line
x = r * np.cos(np.pi / 180 * theta2) + center[0]
y = r * np.sin(np.pi / 180 * theta2) + center[1]
con = ConnectionPatch(xyA=(-width / 2, bar_height), coordsA=ax2.transData,
                      xyB=(x, y), coordsB=ax1.transData)
con.set_color([0, 0, 0])
con.set_linewidth(4)
ax2.add_artist(con)

# draw bottom connecting line
x = r * np.cos(np.pi / 180 * theta1) + center[0]
y = r * np.sin(np.pi / 180 * theta1) + center[1]
con = ConnectionPatch(xyA=(-width / 2, 0), coordsA=ax2.transData,
                      xyB=(x, y), coordsB=ax1.transData)
con.set_color([0, 0, 0])
ax2.add_artist(con)
con.set_linewidth(4)

plt.show()
工具书类
以下函数、方法、类和模块的使用如本例所示:
关键词:matplotlib代码示例,codex,python plot,pyplot Gallery generated by Sphinx-Gallery