注解
Click here 下载完整的示例代码
日期精度和年代
Matplotlib可以处理 datetime 对象和 numpy.datetime64 使用单位转换器识别这些日期并将其转换为浮点数的对象。
在Matplotlib 3.3之前,此转换的默认值返回的浮点值是“0000-12-31T00:00:00”之后的天。从Matplotlib 3.3开始,默认值为“1970-01-01T00:00:00”的天数。这使得现代日期的分辨率更高。”2020-01-01“旧历元转换为730120,64位浮点数的分辨率为2^{-52},约为14微秒,因此微秒精度丢失。新的默认epoch“2020-01-01”是10957.0,因此可实现的分辨率是0.21微秒。
import datetime
import numpy as np

import matplotlib
import matplotlib.pyplot as plt
import matplotlib.dates as mdates


def _reset_epoch_for_tutorial():
    """
    Users (and downstream libraries) should not use the private method of
    resetting the epoch.
    """
    mdates._reset_epoch_test_example()
日期时间
Python datetime 对象具有微秒分辨率,因此使用旧的默认matplotlib dates无法往返于完全分辨率的datetime对象。
old_epoch = '0000-12-31T00:00:00'
new_epoch = '1970-01-01T00:00:00'

_reset_epoch_for_tutorial()  # Don't do this.  Just for this tutorial.
mdates.set_epoch(old_epoch)  # old epoch (pre MPL 3.3)

date1 = datetime.datetime(2000, 1, 1, 0, 10, 0, 12,
                          tzinfo=datetime.timezone.utc)
mdate1 = mdates.date2num(date1)
print('Before Roundtrip: ', date1, 'Matplotlib date:', mdate1)
date2 = mdates.num2date(mdate1)
print('After Roundtrip:  ', date2)
出:
Before Roundtrip:  2000-01-01 00:10:00.000012+00:00 Matplotlib date: 730120.0069444446
After Roundtrip:   2000-01-01 00:10:00.000020+00:00
请注意,这只是一个舍入误差,对于更接近旧纪元的日期没有问题:
date1 = datetime.datetime(10, 1, 1, 0, 10, 0, 12,
                          tzinfo=datetime.timezone.utc)
mdate1 = mdates.date2num(date1)
print('Before Roundtrip: ', date1, 'Matplotlib date:', mdate1)
date2 = mdates.num2date(mdate1)
print('After Roundtrip:  ', date2)
出:
Before Roundtrip:  0010-01-01 00:10:00.000012+00:00 Matplotlib date: 3288.006944444583
After Roundtrip:   0010-01-01 00:10:00.000012+00:00
如果用户想使用微秒精度的现代日期,他们可以使用 set_epoch . 但是,必须在任何日期操作之前设置epoch,以防止不同epoch之间的混淆。试图在以后改变这个时代将会引起一场战争 RuntimeError .
try:
    mdates.set_epoch(new_epoch)  # this is the new MPL 3.3 default.
except RuntimeError as e:
    print('RuntimeError:', str(e))
出:
RuntimeError: set_epoch must be called before dates plotted.
在本教程中,我们使用私有方法重置sentinel,但是用户应该只设置一次epoch(如果有的话)。
_reset_epoch_for_tutorial()  # Just being done for this tutorial.
mdates.set_epoch(new_epoch)

date1 = datetime.datetime(2020, 1, 1, 0, 10, 0, 12,
                          tzinfo=datetime.timezone.utc)
mdate1 = mdates.date2num(date1)
print('Before Roundtrip: ', date1, 'Matplotlib date:', mdate1)
date2 = mdates.num2date(mdate1)
print('After Roundtrip:  ', date2)
出:
Before Roundtrip:  2020-01-01 00:10:00.000012+00:00 Matplotlib date: 18262.006944444583
After Roundtrip:   2020-01-01 00:10:00.000012+00:00
日期时间64
numpy.datetime64 物体具有微秒级的精度,其时间空间远大于 datetime 物体。但是,当前Matplotlib时间仅转换回datetime对象,后者的分辨率为微秒,年份仅从0000到9999。
_reset_epoch_for_tutorial()  # Don't do this.  Just for this tutorial.
mdates.set_epoch(new_epoch)

date1 = np.datetime64('2000-01-01T00:10:00.000012')
mdate1 = mdates.date2num(date1)
print('Before Roundtrip: ', date1, 'Matplotlib date:', mdate1)
date2 = mdates.num2date(mdate1)
print('After Roundtrip:  ', date2)
出:
Before Roundtrip:  2000-01-01T00:10:00.000012 Matplotlib date: 10957.006944444583
After Roundtrip:   2000-01-01 00:10:00.000012+00:00
作图
这一切当然对策划有影响。在旧的默认纪元中,时间被四舍五入,导致数据跳跃:
_reset_epoch_for_tutorial()  # Don't do this.  Just for this tutorial.
mdates.set_epoch(old_epoch)

x = np.arange('2000-01-01T00:00:00.0', '2000-01-01T00:00:00.000100',
              dtype='datetime64[us]')
y = np.arange(0, len(x))
fig, ax = plt.subplots(constrained_layout=True)
ax.plot(x, y)
ax.set_title('Epoch: ' + mdates.get_epoch())
plt.setp(ax.xaxis.get_majorticklabels(), rotation=40)
plt.show()
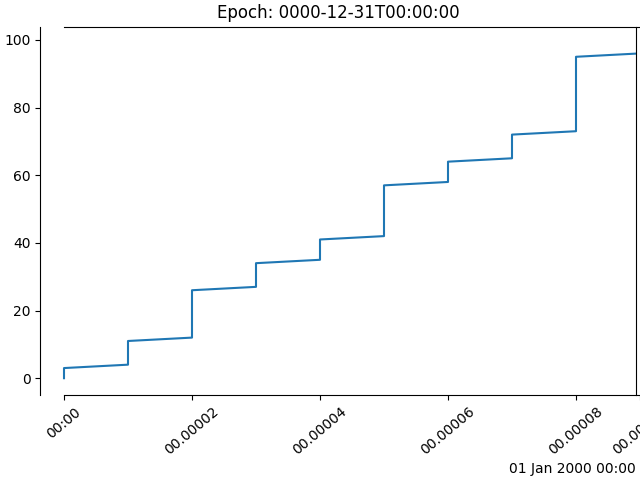
出:
/pb1/rst_repos/git/matplotlib/examples/ticks_and_spines/date_precision_and_epochs.py:127: UserWarning: Plotting microsecond time intervals for dates far from the epoch (time origin: 0000-12-31T00:00:00) is not well-supported. See matplotlib.dates.set_epoch to change the epoch.
  plt.setp(ax.xaxis.get_majorticklabels(), rotation=40)
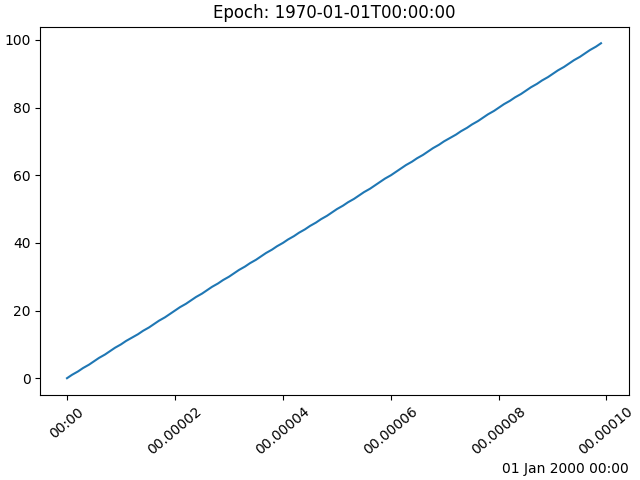
对于最近的一个时代,情节是平滑的:
_reset_epoch_for_tutorial()  # Don't do this.  Just for this tutorial.
mdates.set_epoch(new_epoch)

fig, ax = plt.subplots(constrained_layout=True)
ax.plot(x, y)
ax.set_title('Epoch: ' + mdates.get_epoch())
plt.setp(ax.xaxis.get_majorticklabels(), rotation=40)
plt.show()

_reset_epoch_for_tutorial()  # Don't do this.  Just for this tutorial.
工具书类
本例中显示了以下函数、方法和类的使用:
出:
<function set_epoch at 0x7faa00f19400>
关键词:matplotlib代码示例,codex,python plot,pyplot Gallery generated by Sphinx-Gallery