注解
Click here 下载完整的示例代码
Zorder演示
艺术家的绘画顺序是由他们的 zorder 属性,它是一个浮点数。具有更高 zorder 画在上面。您可以通过设置 zorder . 默认值取决于艺术家的类型:
| 艺术家 | Z阶 |
|---|---|
图像 (AxesImage , FigureImage , BboxImage ) |
0 |
Patch, PatchCollection |
1 |
Line2D , LineCollection (包括次要记号、网格线) |
2 |
| 主要滴答声 | 2.01 |
Text (包括轴标签和标题) |
3 |
Legend |
5 |
对plotting方法的任何调用都可以显式地为该特定项的zorder设置值。
注解
set_axisbelow 和 rcParams["axes.axisbelow"] (default: 'line') 可以进一步修改记号和网格线的zorder。
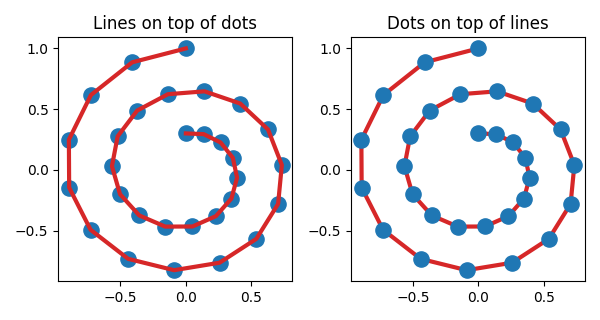
以下示例包含 Line2D 创建的 plot() 点(a) PatchCollection )创建者 scatter() . 因此,在默认情况下,点位于线的下方(第一个子图)。在第二个子图中 zorder 点的顶端被明确地设置为移动。
fig, (ax1, ax2) = plt.subplots(1, 2, figsize=(6, 3.2))

ax1.plot(x, y, 'C3', lw=3)
ax1.scatter(x, y, s=120)
ax1.set_title('Lines on top of dots')

ax2.plot(x, y, 'C3', lw=3)
ax2.scatter(x, y, s=120, zorder=2.5)  # move dots on top of line
ax2.set_title('Dots on top of lines')

plt.tight_layout()
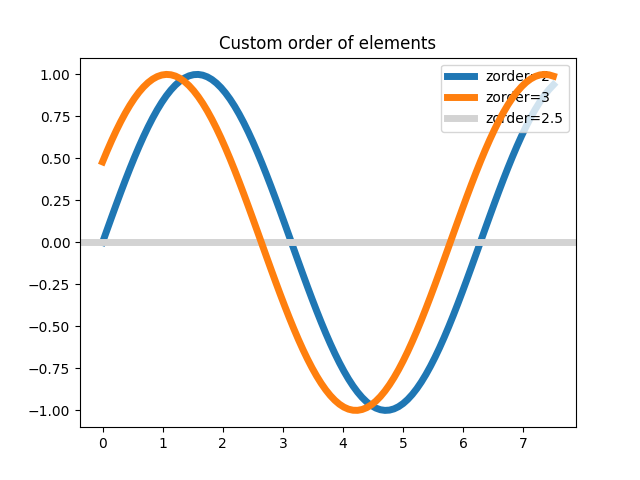
许多创建可见对象的函数都接受 zorder 参数。或者,你可以打电话 set_order() 在稍后创建的对象上。
x = np.linspace(0, 7.5, 100)
plt.rcParams['lines.linewidth'] = 5
plt.figure()
plt.plot(x, np.sin(x), label='zorder=2', zorder=2)  # bottom
plt.plot(x, np.sin(x+0.5), label='zorder=3',  zorder=3)
plt.axhline(0, label='zorder=2.5', color='lightgrey', zorder=2.5)
plt.title('Custom order of elements')
l = plt.legend(loc='upper right')
l.set_zorder(2.5)  # legend between blue and orange line
plt.show()
脚本的总运行时间: (0分1.004秒)
关键词:matplotlib代码示例,codex,python plot,pyplot Gallery generated by Sphinx-Gallery