注解
Click here 下载完整的示例代码
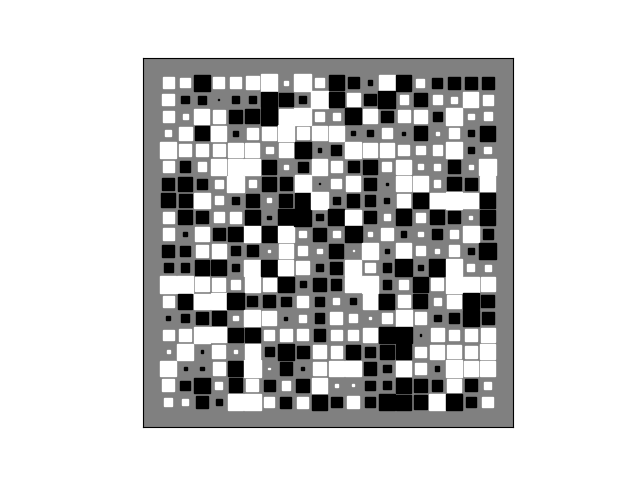
Hinton图
Hinton图可用于可视化二维数组的值(例如权重矩阵):正值和负值分别由白色和黑色的方块表示,每个方块的大小表示每个值的大小。
大卫·沃德·法利在《科幻食谱》上的初步想法
import numpy as np
import matplotlib.pyplot as plt


def hinton(matrix, max_weight=None, ax=None):
    """Draw Hinton diagram for visualizing a weight matrix."""
    ax = ax if ax is not None else plt.gca()

    if not max_weight:
        max_weight = 2 ** np.ceil(np.log2(np.abs(matrix).max()))

    ax.patch.set_facecolor('gray')
    ax.set_aspect('equal', 'box')
    ax.xaxis.set_major_locator(plt.NullLocator())
    ax.yaxis.set_major_locator(plt.NullLocator())

    for (x, y), w in np.ndenumerate(matrix):
        color = 'white' if w > 0 else 'black'
        size = np.sqrt(abs(w) / max_weight)
        rect = plt.Rectangle([x - size / 2, y - size / 2], size, size,
                             facecolor=color, edgecolor=color)
        ax.add_patch(rect)

    ax.autoscale_view()
    ax.invert_yaxis()


if __name__ == '__main__':
    # Fixing random state for reproducibility
    np.random.seed(19680801)

    hinton(np.random.rand(20, 20) - 0.5)
    plt.show()
关键词:matplotlib代码示例,codex,python plot,pyplot Gallery generated by Sphinx-Gallery