注解
Click here 下载完整的示例代码
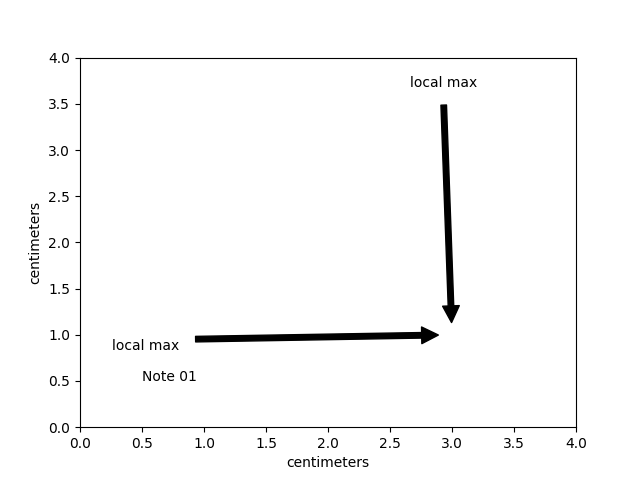
带单位的批注
该示例说明如何使用厘米刻度图创建文本和箭头注释。
此示例要求 basic_units.py
import matplotlib.pyplot as plt
from basic_units import cm

fig, ax = plt.subplots()

ax.annotate("Note 01", [0.5*cm, 0.5*cm])

# xy and text both unitized
ax.annotate('local max', xy=(3*cm, 1*cm), xycoords='data',
            xytext=(0.8*cm, 0.95*cm), textcoords='data',
            arrowprops=dict(facecolor='black', shrink=0.05),
            horizontalalignment='right', verticalalignment='top')

# mixing units w/ nonunits
ax.annotate('local max', xy=(3*cm, 1*cm), xycoords='data',
            xytext=(0.8, 0.95), textcoords='axes fraction',
            arrowprops=dict(facecolor='black', shrink=0.05),
            horizontalalignment='right', verticalalignment='top')


ax.set_xlim(0*cm, 4*cm)
ax.set_ylim(0*cm, 4*cm)
plt.show()
关键词:matplotlib代码示例,codex,python plot,pyplot Gallery generated by Sphinx-Gallery