注解
Click here 下载完整的示例代码
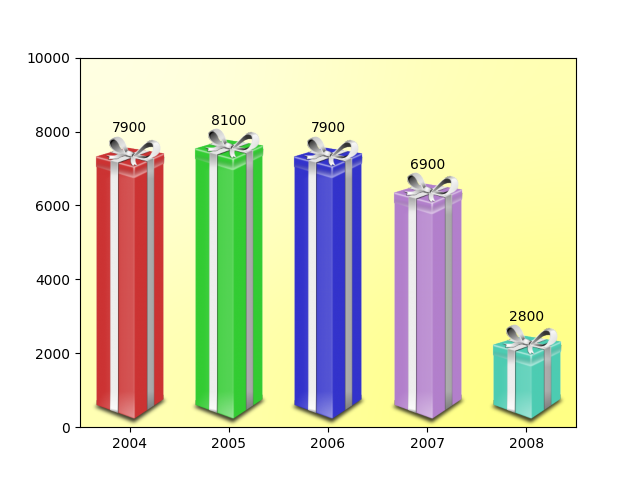
色带盒
import numpy as np

from matplotlib import cbook, colors as mcolors
from matplotlib.image import AxesImage
import matplotlib.pyplot as plt
from matplotlib.transforms import Bbox, TransformedBbox, BboxTransformTo


class RibbonBox:

    original_image = plt.imread(
        cbook.get_sample_data("Minduka_Present_Blue_Pack.png"))
    cut_location = 70
    b_and_h = original_image[:, :, 2:3]
    color = original_image[:, :, 2:3] - original_image[:, :, 0:1]
    alpha = original_image[:, :, 3:4]
    nx = original_image.shape[1]

    def __init__(self, color):
        rgb = mcolors.to_rgba(color)[:3]
        self.im = np.dstack(
            [self.b_and_h - self.color * (1 - np.array(rgb)), self.alpha])

    def get_stretched_image(self, stretch_factor):
        stretch_factor = max(stretch_factor, 1)
        ny, nx, nch = self.im.shape
        ny2 = int(ny*stretch_factor)
        return np.vstack(
            [self.im[:self.cut_location],
             np.broadcast_to(
                 self.im[self.cut_location], (ny2 - ny, nx, nch)),
             self.im[self.cut_location:]])


class RibbonBoxImage(AxesImage):
    zorder = 1

    def __init__(self, ax, bbox, color, *, extent=(0, 1, 0, 1), **kwargs):
        super().__init__(ax, extent=extent, **kwargs)
        self._bbox = bbox
        self._ribbonbox = RibbonBox(color)
        self.set_transform(BboxTransformTo(bbox))

    def draw(self, renderer, *args, **kwargs):
        stretch_factor = self._bbox.height / self._bbox.width

        ny = int(stretch_factor*self._ribbonbox.nx)
        if self.get_array() is None or self.get_array().shape[0] != ny:
            arr = self._ribbonbox.get_stretched_image(stretch_factor)
            self.set_array(arr)

        super().draw(renderer, *args, **kwargs)


def main():
    fig, ax = plt.subplots()

    years = np.arange(2004, 2009)
    heights = [7900, 8100, 7900, 6900, 2800]
    box_colors = [
        (0.8, 0.2, 0.2),
        (0.2, 0.8, 0.2),
        (0.2, 0.2, 0.8),
        (0.7, 0.5, 0.8),
        (0.3, 0.8, 0.7),
    ]

    for year, h, bc in zip(years, heights, box_colors):
        bbox0 = Bbox.from_extents(year - 0.4, 0., year + 0.4, h)
        bbox = TransformedBbox(bbox0, ax.transData)
        ax.add_artist(RibbonBoxImage(ax, bbox, bc, interpolation="bicubic"))
        ax.annotate(str(h), (year, h), va="bottom", ha="center")

    ax.set_xlim(years[0] - 0.5, years[-1] + 0.5)
    ax.set_ylim(0, 10000)

    background_gradient = np.zeros((2, 2, 4))
    background_gradient[:, :, :3] = [1, 1, 0]
    background_gradient[:, :, 3] = [[0.1, 0.3], [0.3, 0.5]]  # alpha channel
    ax.imshow(background_gradient, interpolation="bicubic", zorder=0.1,
              extent=(0, 1, 0, 1), transform=ax.transAxes, aspect="auto")

    plt.show()


main()
脚本的总运行时间: (0分1.067秒)
关键词:matplotlib代码示例,codex,python plot,pyplot Gallery generated by Sphinx-Gallery