注解
Click here 下载完整的示例代码
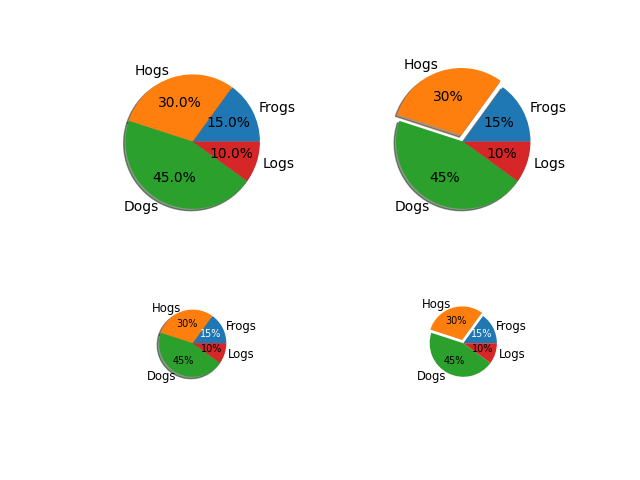
饼状二氧化物
制作饼图使用 pie .
此示例演示了一些饼图功能,如标签、不同大小、自动标记百分比、偏移切片和添加阴影。
import matplotlib.pyplot as plt

# Some data
labels = 'Frogs', 'Hogs', 'Dogs', 'Logs'
fracs = [15, 30, 45, 10]

# Make figure and axes
fig, axs = plt.subplots(2, 2)

# A standard pie plot
axs[0, 0].pie(fracs, labels=labels, autopct='%1.1f%%', shadow=True)

# Shift the second slice using explode
axs[0, 1].pie(fracs, labels=labels, autopct='%.0f%%', shadow=True,
              explode=(0, 0.1, 0, 0))

# Adapt radius and text size for a smaller pie
patches, texts, autotexts = axs[1, 0].pie(fracs, labels=labels,
                                          autopct='%.0f%%',
                                          textprops={'size': 'smaller'},
                                          shadow=True, radius=0.5)
# Make percent texts even smaller
plt.setp(autotexts, size='x-small')
autotexts[0].set_color('white')

# Use a smaller explode and turn of the shadow for better visibility
patches, texts, autotexts = axs[1, 1].pie(fracs, labels=labels,
                                          autopct='%.0f%%',
                                          textprops={'size': 'smaller'},
                                          shadow=False, radius=0.5,
                                          explode=(0, 0.05, 0, 0))
plt.setp(autotexts, size='x-small')
autotexts[0].set_color('white')

plt.show()
工具书类
以下函数、方法、类和模块的使用如本例所示:
import matplotlib
matplotlib.axes.Axes.pie
matplotlib.pyplot.pie
出:
<function pie at 0x7faa00cfd048>
关键词:matplotlib代码示例,codex,python plot,pyplot Gallery generated by Sphinx-Gallery