注解
Click here 下载完整的示例代码
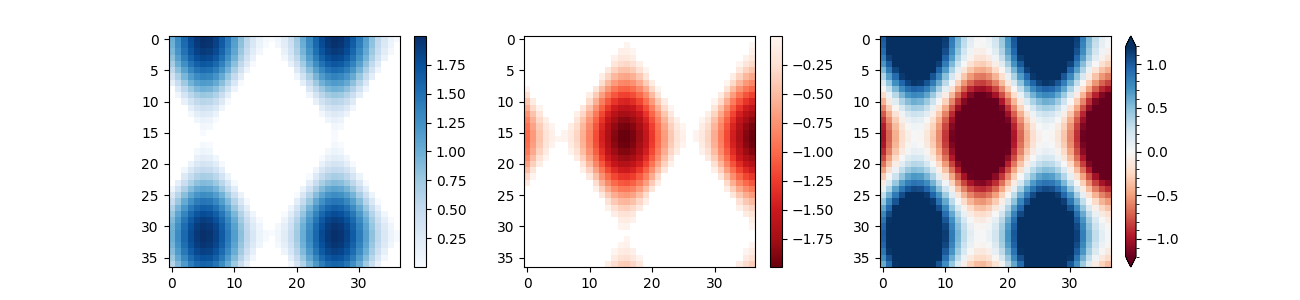
测控条
使用 colorbar 通过指定可映射对象(此处 AxesImage 返回的 imshow )以及要连接颜色条的轴。
import numpy as np
import matplotlib.pyplot as plt

# setup some generic data
N = 37
x, y = np.mgrid[:N, :N]
Z = (np.cos(x*0.2) + np.sin(y*0.3))

# mask out the negative and positive values, respectively
Zpos = np.ma.masked_less(Z, 0)
Zneg = np.ma.masked_greater(Z, 0)

fig, (ax1, ax2, ax3) = plt.subplots(figsize=(13, 3), ncols=3)

# plot just the positive data and save the
# color "mappable" object returned by ax1.imshow
pos = ax1.imshow(Zpos, cmap='Blues', interpolation='none')

# add the colorbar using the figure's method,
# telling which mappable we're talking about and
# which axes object it should be near
fig.colorbar(pos, ax=ax1)

# repeat everything above for the negative data
neg = ax2.imshow(Zneg, cmap='Reds_r', interpolation='none')
fig.colorbar(neg, ax=ax2)

# Plot both positive and negative values between +/- 1.2
pos_neg_clipped = ax3.imshow(Z, cmap='RdBu', vmin=-1.2, vmax=1.2,
                             interpolation='none')
# Add minorticks on the colorbar to make it easy to read the
# values off the colorbar.
cbar = fig.colorbar(pos_neg_clipped, ax=ax3, extend='both')
cbar.minorticks_on()
plt.show()
工具书类
以下函数、方法、类和模块的使用如本例所示:
import matplotlib
import matplotlib.colorbar
matplotlib.axes.Axes.imshow
matplotlib.pyplot.imshow
matplotlib.figure.Figure.colorbar
matplotlib.pyplot.colorbar
matplotlib.colorbar.Colorbar.minorticks_on
matplotlib.colorbar.Colorbar.minorticks_off
出:
<function ColorbarBase.minorticks_off at 0x7faa1660a400>
关键词:matplotlib代码示例,codex,python plot,pyplot Gallery generated by Sphinx-Gallery