注解
Click here 下载完整的示例代码
PyPrPro三
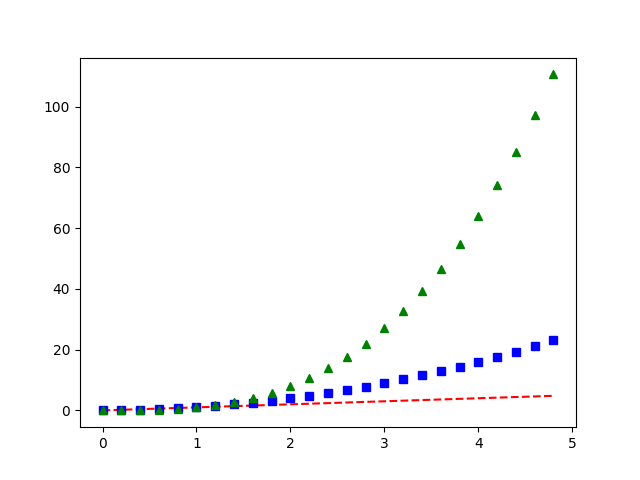
在一次调用中绘制三行图 plot .
工具书类
以下函数、方法、类和模块的使用如本例所示:
import matplotlib
matplotlib.pyplot.plot
matplotlib.axes.Axes.plot
出:
<function Axes.plot at 0x7faa00db6048>
关键词:matplotlib代码示例,codex,python plot,pyplot Gallery generated by Sphinx-Gallery