注解
Click here 下载完整的示例代码
使用受约束的布局调整轴的大小
受约束的布局试图调整图形中的子图的大小,以便轴对象和轴上的标签之间不存在重叠。
见 受约束的布局参考线 更多详细信息和 紧密布局指南 作为另一种选择。
import matplotlib.pyplot as plt


def example_plot(ax):
    ax.plot([1, 2])
    ax.set_xlabel('x-label', fontsize=12)
    ax.set_ylabel('y-label', fontsize=12)
    ax.set_title('Title', fontsize=14)
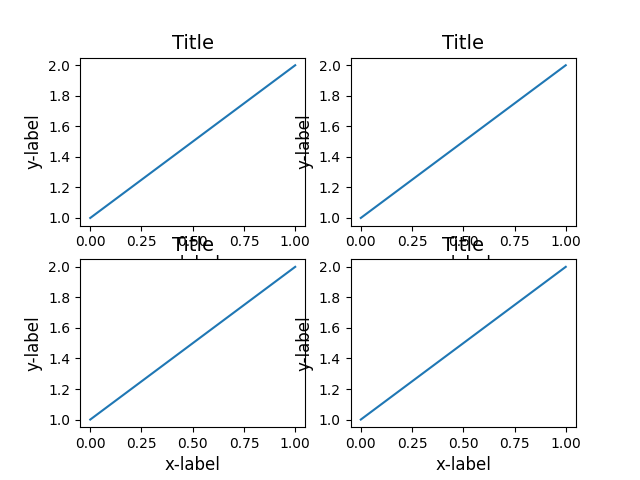
如果不使用受约束的布局,则标签与轴重叠
fig, axs = plt.subplots(nrows=2, ncols=2, constrained_layout=False)

for ax in axs.flat:
    example_plot(ax)
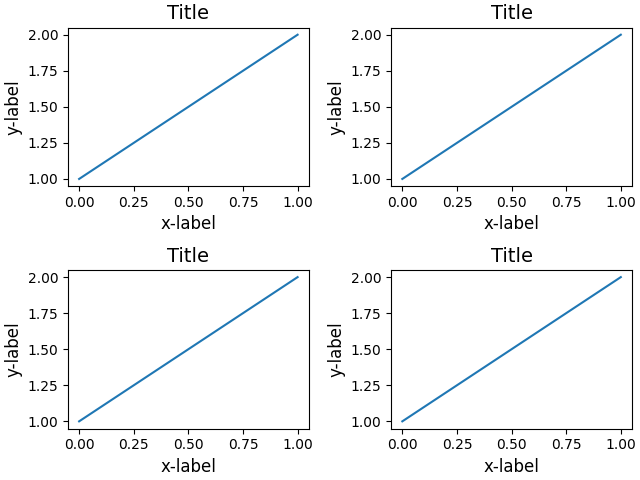
添加 constrained_layout=True 自动调整。
fig, axs = plt.subplots(nrows=2, ncols=2, constrained_layout=True)

for ax in axs.flat:
    example_plot(ax)
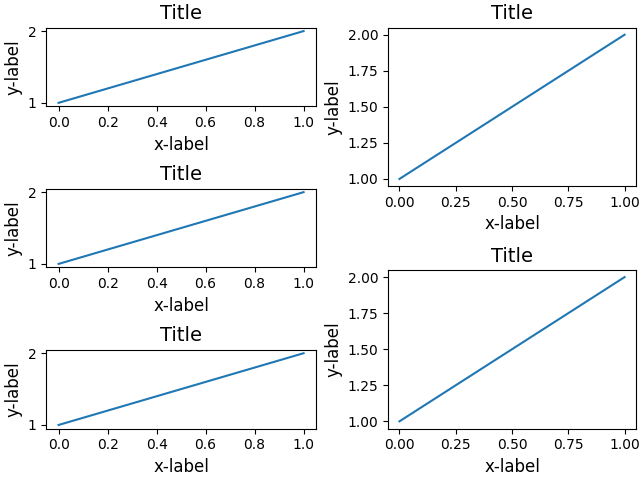
下面是一个使用嵌套网格规范的更复杂的示例。
fig = plt.figure(constrained_layout=True)

import matplotlib.gridspec as gridspec

gs0 = gridspec.GridSpec(1, 2, figure=fig)

gs1 = gridspec.GridSpecFromSubplotSpec(3, 1, subplot_spec=gs0[0])
for n in range(3):
    ax = fig.add_subplot(gs1[n])
    example_plot(ax)


gs2 = gridspec.GridSpecFromSubplotSpec(2, 1, subplot_spec=gs0[1])
for n in range(2):
    ax = fig.add_subplot(gs2[n])
    example_plot(ax)

plt.show()
工具书类
本例中显示了以下函数和方法的使用:
import matplotlib
matplotlib.gridspec.GridSpec
matplotlib.gridspec.GridSpecFromSubplotSpec
脚本的总运行时间: (0分2.082秒)
关键词:matplotlib代码示例,codex,python plot,pyplot Gallery generated by Sphinx-Gallery