注解
Click here 下载完整的示例代码
误差条限制选择
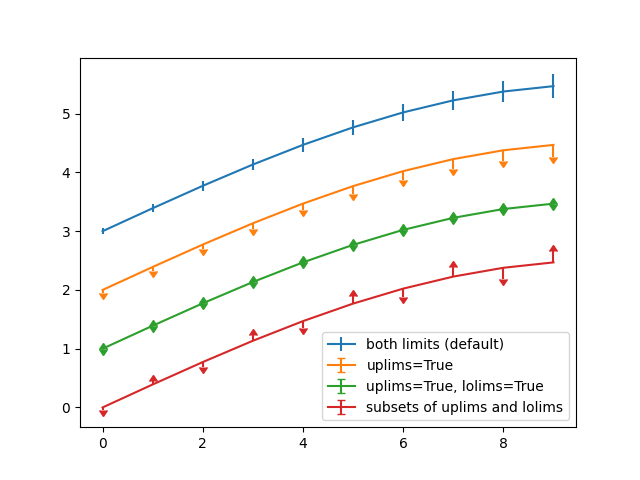
使用参数在误差条上选择性绘制下限和/或上限符号的图示 uplims , lolims 属于 errorbar .
或者,可以使用2xN值只在一个方向绘制误差条。
import numpy as np
import matplotlib.pyplot as plt


fig = plt.figure()
x = np.arange(10)
y = 2.5 * np.sin(x / 20 * np.pi)
yerr = np.linspace(0.05, 0.2, 10)

plt.errorbar(x, y + 3, yerr=yerr, label='both limits (default)')

plt.errorbar(x, y + 2, yerr=yerr, uplims=True, label='uplims=True')

plt.errorbar(x, y + 1, yerr=yerr, uplims=True, lolims=True,
             label='uplims=True, lolims=True')

upperlimits = [True, False] * 5
lowerlimits = [False, True] * 5
plt.errorbar(x, y, yerr=yerr, uplims=upperlimits, lolims=lowerlimits,
             label='subsets of uplims and lolims')

plt.legend(loc='lower right')
出:
<matplotlib.legend.Legend object at 0x7faa0fb26208>
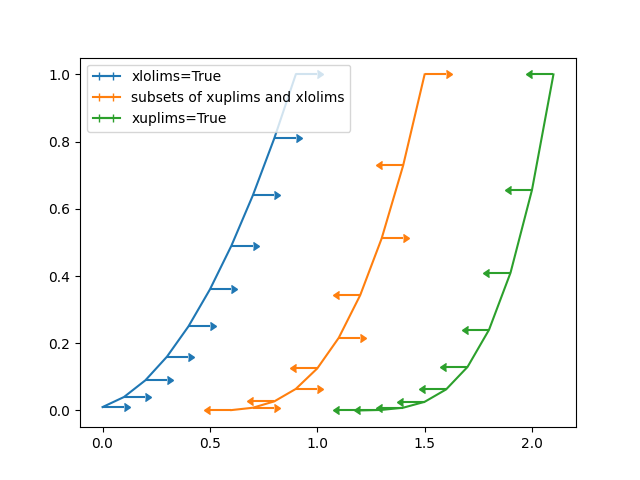
同样 xuplims 和 xlolims 可在水平面上使用 xerr 误差条。
fig = plt.figure()
x = np.arange(10) / 10
y = (x + 0.1)**2

plt.errorbar(x, y, xerr=0.1, xlolims=True, label='xlolims=True')
y = (x + 0.1)**3

plt.errorbar(x + 0.6, y, xerr=0.1, xuplims=upperlimits, xlolims=lowerlimits,
             label='subsets of xuplims and xlolims')

y = (x + 0.1)**4
plt.errorbar(x + 1.2, y, xerr=0.1, xuplims=True, label='xuplims=True')

plt.legend()
plt.show()
工具书类
以下函数、方法、类和模块的使用如本例所示:
import matplotlib
matplotlib.axes.Axes.errorbar
matplotlib.pyplot.errorbar
出:
<function errorbar at 0x7faa00cfa488>
关键词:matplotlib代码示例,codex,python plot,pyplot Gallery generated by Sphinx-Gallery