注解
Click here 下载完整的示例代码
在二维图像中混合透明度和颜色
将透明度与颜色混合,用imshow突出显示部分数据。
常用于 matplotlib.pyplot.imshow 绘制一张二维统计图。该函数可以很容易地将二维矩阵可视化为图像,并为输出添加透明度。例如,可以绘制一个统计(例如t统计)并根据每个像素的p值为其透明度着色。这个例子演示了如何达到这个效果。
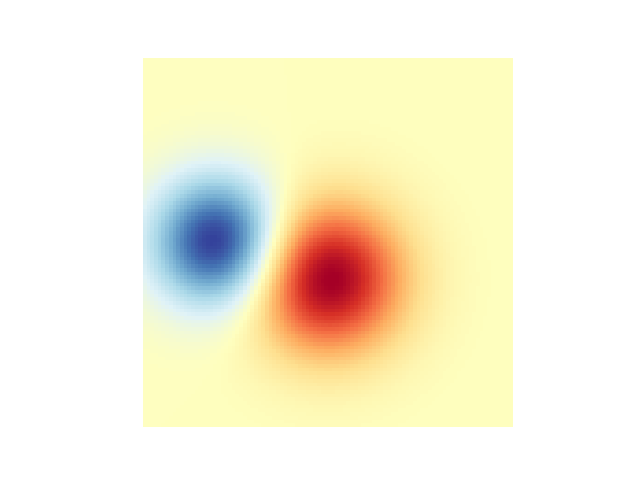
首先,我们将生成一些数据,在本例中,我们将在二维网格中创建两个二维“blob”。一个斑点是正的,另一个是负的。
import numpy as np
import matplotlib.pyplot as plt
from matplotlib.colors import Normalize


def normal_pdf(x, mean, var):
    return np.exp(-(x - mean)**2 / (2*var))


# Generate the space in which the blobs will live
xmin, xmax, ymin, ymax = (0, 100, 0, 100)
n_bins = 100
xx = np.linspace(xmin, xmax, n_bins)
yy = np.linspace(ymin, ymax, n_bins)

# Generate the blobs. The range of the values is roughly -.0002 to .0002
means_high = [20, 50]
means_low = [50, 60]
var = [150, 200]

gauss_x_high = normal_pdf(xx, means_high[0], var[0])
gauss_y_high = normal_pdf(yy, means_high[1], var[0])

gauss_x_low = normal_pdf(xx, means_low[0], var[1])
gauss_y_low = normal_pdf(yy, means_low[1], var[1])

weights = (np.outer(gauss_y_high, gauss_x_high)
           - np.outer(gauss_y_low, gauss_x_low))

# We'll also create a grey background into which the pixels will fade
greys = np.full((*weights.shape, 3), 70, dtype=np.uint8)

# First we'll plot these blobs using ``imshow`` without transparency.
vmax = np.abs(weights).max()
imshow_kwargs = {
    'vmax': vmax,
    'vmin': -vmax,
    'cmap': 'RdYlBu',
    'extent': (xmin, xmax, ymin, ymax),
}

fig, ax = plt.subplots()
ax.imshow(greys)
ax.imshow(weights, **imshow_kwargs)
ax.set_axis_off()
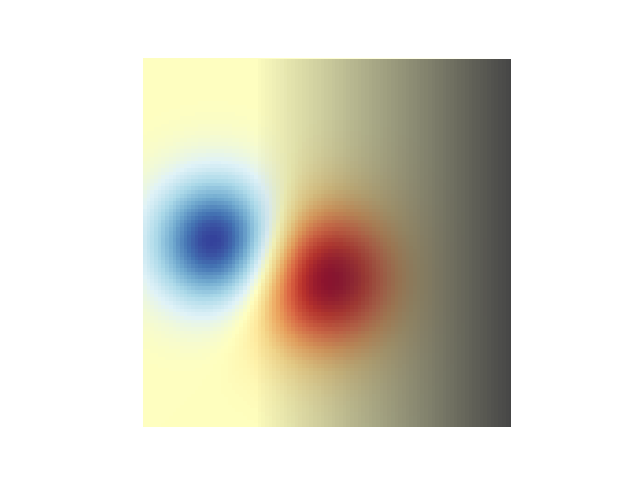
混入透明度
绘制数据时包含透明度的最简单方法 matplotlib.pyplot.imshow 将匹配数据形状的数组传递给 alpha 争论。例如,我们将创建一个从左到右的渐变。
# Create an alpha channel of linearly increasing values moving to the right.
alphas = np.ones(weights.shape)
alphas[:, 30:] = np.linspace(1, 0, 70)

# Create the figure and image
# Note that the absolute values may be slightly different
fig, ax = plt.subplots()
ax.imshow(greys)
ax.imshow(weights, alpha=alphas, **imshow_kwargs)
ax.set_axis_off()
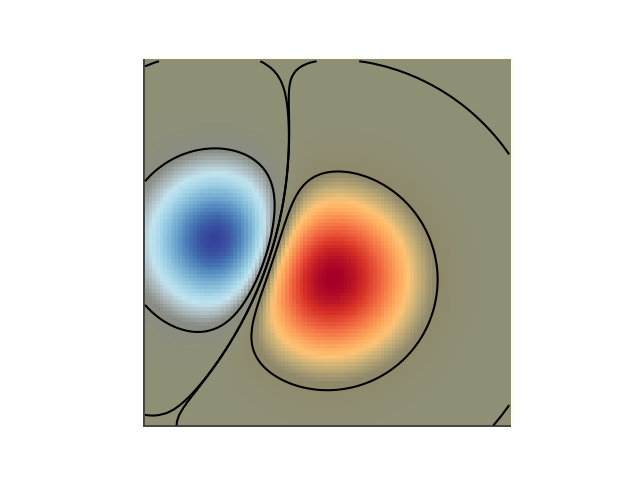
使用透明度突出显示高振幅值
最后,我们将重新创建相同的图,但这次我们将使用透明度来突出显示数据中的极端值。这通常用于突出显示具有较小p值的数据点。我们还将添加轮廓线以突出显示图像值。
# Create an alpha channel based on weight values
# Any value whose absolute value is > .0001 will have zero transparency
alphas = Normalize(0, .3, clip=True)(np.abs(weights))
alphas = np.clip(alphas, .4, 1)  # alpha value clipped at the bottom at .4

# Create the figure and image
# Note that the absolute values may be slightly different
fig, ax = plt.subplots()
ax.imshow(greys)
ax.imshow(weights, alpha=alphas, **imshow_kwargs)

# Add contour lines to further highlight different levels.
ax.contour(weights[::-1], levels=[-.1, .1], colors='k', linestyles='-')
ax.set_axis_off()
plt.show()

ax.contour(weights[::-1], levels=[-.0001, .0001], colors='k', linestyles='-')
ax.set_axis_off()
plt.show()
工具书类
本例中显示了以下函数、方法和类的使用:
出:
<function _AxesBase.set_axis_off at 0x7faa00da6950>
关键词:matplotlib代码示例,codex,python plot,pyplot Gallery generated by Sphinx-Gallery