注解
Click here 下载完整的示例代码
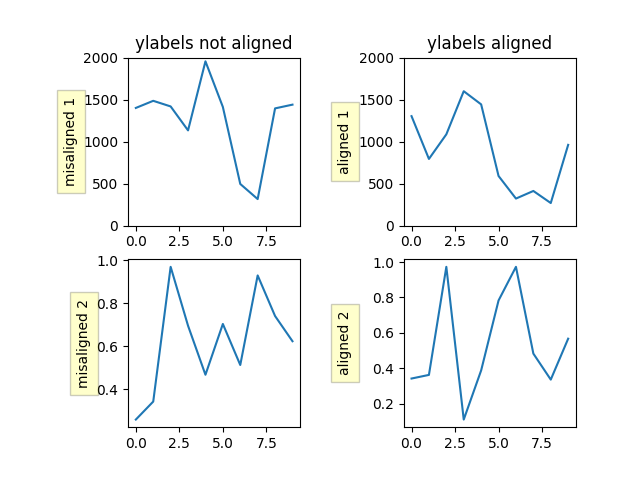
对齐Y标签
这里显示了两种方法,一种使用短调用 Figure.align_ylabels 第二种是手动对齐标签的方法。
import numpy as np
import matplotlib.pyplot as plt


def make_plot(axs):
    box = dict(facecolor='yellow', pad=5, alpha=0.2)

    # Fixing random state for reproducibility
    np.random.seed(19680801)
    ax1 = axs[0, 0]
    ax1.plot(2000*np.random.rand(10))
    ax1.set_title('ylabels not aligned')
    ax1.set_ylabel('misaligned 1', bbox=box)
    ax1.set_ylim(0, 2000)

    ax3 = axs[1, 0]
    ax3.set_ylabel('misaligned 2', bbox=box)
    ax3.plot(np.random.rand(10))

    ax2 = axs[0, 1]
    ax2.set_title('ylabels aligned')
    ax2.plot(2000*np.random.rand(10))
    ax2.set_ylabel('aligned 1', bbox=box)
    ax2.set_ylim(0, 2000)

    ax4 = axs[1, 1]
    ax4.plot(np.random.rand(10))
    ax4.set_ylabel('aligned 2', bbox=box)


# Plot 1:
fig, axs = plt.subplots(2, 2)
fig.subplots_adjust(left=0.2, wspace=0.6)
make_plot(axs)

# just align the last column of axes:
fig.align_ylabels(axs[:, 1])
plt.show()

参见
Figure.align_ylabels and Figure.align_labels for a direct method
of doing the same thing.
Also 对齐标签
或者我们可以使用 set_label_coords Y轴对象的方法。注:这要求我们知道一个硬编码的良好偏移值。
工具书类
以下函数、方法、类和模块的使用如本例所示:
出:
<function _AxesBase.set_ylim at 0x7faa00da70d0>
脚本的总运行时间: (0分1.127秒)
关键词:matplotlib代码示例,codex,python plot,pyplot Gallery generated by Sphinx-Gallery