注解
Click here 下载完整的示例代码
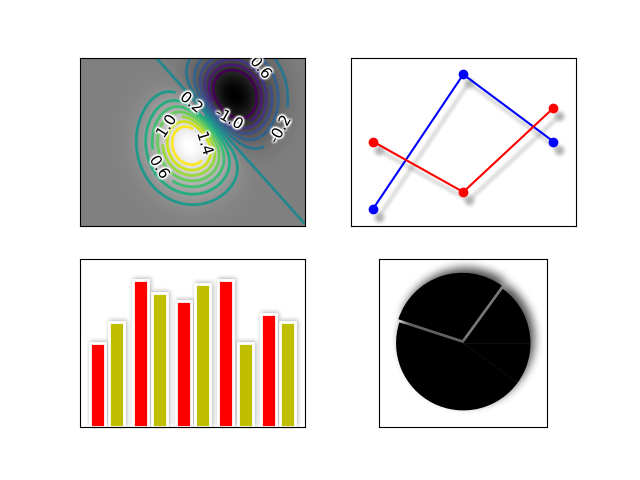
演示AGG滤波器
import matplotlib.cm as cm
import matplotlib.pyplot as plt
import matplotlib.transforms as mtransforms
from matplotlib.colors import LightSource
from matplotlib.artist import Artist
import numpy as np


def smooth1d(x, window_len):
    # copied from http://www.scipy.org/Cookbook/SignalSmooth
    s = np.r_[2*x[0] - x[window_len:1:-1], x, 2*x[-1] - x[-1:-window_len:-1]]
    w = np.hanning(window_len)
    y = np.convolve(w/w.sum(), s, mode='same')
    return y[window_len-1:-window_len+1]


def smooth2d(A, sigma=3):
    window_len = max(int(sigma), 3) * 2 + 1
    A = np.apply_along_axis(smooth1d, 0, A, window_len)
    A = np.apply_along_axis(smooth1d, 1, A, window_len)
    return A


class BaseFilter:

    def get_pad(self, dpi):
        return 0

    def process_image(padded_src, dpi):
        raise NotImplementedError("Should be overridden by subclasses")

    def __call__(self, im, dpi):
        pad = self.get_pad(dpi)
        padded_src = np.pad(im, [(pad, pad), (pad, pad), (0, 0)], "constant")
        tgt_image = self.process_image(padded_src, dpi)
        return tgt_image, -pad, -pad


class OffsetFilter(BaseFilter):

    def __init__(self, offsets=(0, 0)):
        self.offsets = offsets

    def get_pad(self, dpi):
        return int(max(self.offsets) / 72 * dpi)

    def process_image(self, padded_src, dpi):
        ox, oy = self.offsets
        a1 = np.roll(padded_src, int(ox / 72 * dpi), axis=1)
        a2 = np.roll(a1, -int(oy / 72 * dpi), axis=0)
        return a2


class GaussianFilter(BaseFilter):
    """Simple Gaussian filter."""

    def __init__(self, sigma, alpha=0.5, color=(0, 0, 0)):
        self.sigma = sigma
        self.alpha = alpha
        self.color = color

    def get_pad(self, dpi):
        return int(self.sigma*3 / 72 * dpi)

    def process_image(self, padded_src, dpi):
        tgt_image = np.empty_like(padded_src)
        tgt_image[:, :, :3] = self.color
        tgt_image[:, :, 3] = smooth2d(padded_src[:, :, 3] * self.alpha,
                                      self.sigma / 72 * dpi)
        return tgt_image


class DropShadowFilter(BaseFilter):

    def __init__(self, sigma, alpha=0.3, color=(0, 0, 0), offsets=(0, 0)):
        self.gauss_filter = GaussianFilter(sigma, alpha, color)
        self.offset_filter = OffsetFilter(offsets)

    def get_pad(self, dpi):
        return max(self.gauss_filter.get_pad(dpi),
                   self.offset_filter.get_pad(dpi))

    def process_image(self, padded_src, dpi):
        t1 = self.gauss_filter.process_image(padded_src, dpi)
        t2 = self.offset_filter.process_image(t1, dpi)
        return t2


class LightFilter(BaseFilter):

    def __init__(self, sigma, fraction=0.5):
        self.gauss_filter = GaussianFilter(sigma, alpha=1)
        self.light_source = LightSource()
        self.fraction = fraction

    def get_pad(self, dpi):
        return self.gauss_filter.get_pad(dpi)

    def process_image(self, padded_src, dpi):
        t1 = self.gauss_filter.process_image(padded_src, dpi)
        elevation = t1[:, :, 3]
        rgb = padded_src[:, :, :3]
        alpha = padded_src[:, :, 3:]
        rgb2 = self.light_source.shade_rgb(rgb, elevation,
                                           fraction=self.fraction)
        return np.concatenate([rgb2, alpha], -1)


class GrowFilter(BaseFilter):
    """Enlarge the area."""

    def __init__(self, pixels, color=(1, 1, 1)):
        self.pixels = pixels
        self.color = color

    def __call__(self, im, dpi):
        alpha = np.pad(im[..., 3], self.pixels, "constant")
        alpha2 = np.clip(smooth2d(alpha, self.pixels / 72 * dpi) * 5, 0, 1)
        new_im = np.empty((*alpha2.shape, 4))
        new_im[:, :, :3] = self.color
        new_im[:, :, 3] = alpha2
        offsetx, offsety = -self.pixels, -self.pixels
        return new_im, offsetx, offsety


class FilteredArtistList(Artist):
    """A simple container to filter multiple artists at once."""

    def __init__(self, artist_list, filter):
        super().__init__()
        self._artist_list = artist_list
        self._filter = filter

    def draw(self, renderer):
        renderer.start_rasterizing()
        renderer.start_filter()
        for a in self._artist_list:
            a.draw(renderer)
        renderer.stop_filter(self._filter)
        renderer.stop_rasterizing()


def filtered_text(ax):
    # mostly copied from contour_demo.py

    # prepare image
    delta = 0.025
    x = np.arange(-3.0, 3.0, delta)
    y = np.arange(-2.0, 2.0, delta)
    X, Y = np.meshgrid(x, y)
    Z1 = np.exp(-X**2 - Y**2)
    Z2 = np.exp(-(X - 1)**2 - (Y - 1)**2)
    Z = (Z1 - Z2) * 2

    # draw
    ax.imshow(Z, interpolation='bilinear', origin='lower',
              cmap=cm.gray, extent=(-3, 3, -2, 2), aspect='auto')
    levels = np.arange(-1.2, 1.6, 0.2)
    CS = ax.contour(Z, levels,
                    origin='lower',
                    linewidths=2,
                    extent=(-3, 3, -2, 2))

    # contour label
    cl = ax.clabel(CS, levels[1::2],  # label every second level
                   inline=True,
                   fmt='%1.1f',
                   fontsize=11)

    # change clabel color to black
    from matplotlib.patheffects import Normal
    for t in cl:
        t.set_color("k")
        # to force TextPath (i.e., same font in all backends)
        t.set_path_effects([Normal()])

    # Add white glows to improve visibility of labels.
    white_glows = FilteredArtistList(cl, GrowFilter(3))
    ax.add_artist(white_glows)
    white_glows.set_zorder(cl[0].get_zorder() - 0.1)

    ax.xaxis.set_visible(False)
    ax.yaxis.set_visible(False)


def drop_shadow_line(ax):
    # copied from examples/misc/svg_filter_line.py

    # draw lines
    l1, = ax.plot([0.1, 0.5, 0.9], [0.1, 0.9, 0.5], "bo-")
    l2, = ax.plot([0.1, 0.5, 0.9], [0.5, 0.2, 0.7], "ro-")

    gauss = DropShadowFilter(4)

    for l in [l1, l2]:

        # draw shadows with same lines with slight offset.
        xx = l.get_xdata()
        yy = l.get_ydata()
        shadow, = ax.plot(xx, yy)
        shadow.update_from(l)

        # offset transform
        ot = mtransforms.offset_copy(l.get_transform(), ax.figure,
                                     x=4.0, y=-6.0, units='points')

        shadow.set_transform(ot)

        # adjust zorder of the shadow lines so that it is drawn below the
        # original lines
        shadow.set_zorder(l.get_zorder() - 0.5)
        shadow.set_agg_filter(gauss)
        shadow.set_rasterized(True)  # to support mixed-mode renderers

    ax.set_xlim(0., 1.)
    ax.set_ylim(0., 1.)

    ax.xaxis.set_visible(False)
    ax.yaxis.set_visible(False)


def drop_shadow_patches(ax):
    # Copied from barchart_demo.py
    N = 5
    men_means = [20, 35, 30, 35, 27]

    ind = np.arange(N)  # the x locations for the groups
    width = 0.35  # the width of the bars

    rects1 = ax.bar(ind, men_means, width, color='r', ec="w", lw=2)

    women_means = [25, 32, 34, 20, 25]
    rects2 = ax.bar(ind + width + 0.1, women_means, width,
                    color='y', ec="w", lw=2)

    # gauss = GaussianFilter(1.5, offsets=(1, 1))
    gauss = DropShadowFilter(5, offsets=(1, 1))
    shadow = FilteredArtistList(rects1 + rects2, gauss)
    ax.add_artist(shadow)
    shadow.set_zorder(rects1[0].get_zorder() - 0.1)

    ax.set_ylim(0, 40)

    ax.xaxis.set_visible(False)
    ax.yaxis.set_visible(False)


def light_filter_pie(ax):
    fracs = [15, 30, 45, 10]
    explode = (0, 0.05, 0, 0)
    pies = ax.pie(fracs, explode=explode)

    light_filter = LightFilter(9)
    for p in pies[0]:
        p.set_agg_filter(light_filter)
        p.set_rasterized(True)  # to support mixed-mode renderers
        p.set(ec="none",
              lw=2)

    gauss = DropShadowFilter(9, offsets=(3, 4), alpha=0.7)
    shadow = FilteredArtistList(pies[0], gauss)
    ax.add_artist(shadow)
    shadow.set_zorder(pies[0][0].get_zorder() - 0.1)


if __name__ == "__main__":

    fix, axs = plt.subplots(2, 2)

    filtered_text(axs[0, 0])
    drop_shadow_line(axs[0, 1])
    drop_shadow_patches(axs[1, 0])
    light_filter_pie(axs[1, 1])
    axs[1, 1].set_frame_on(True)

    plt.show()
关键词:matplotlib代码示例,codex,python plot,pyplot Gallery generated by Sphinx-Gallery