注解
Click here 下载完整的示例代码
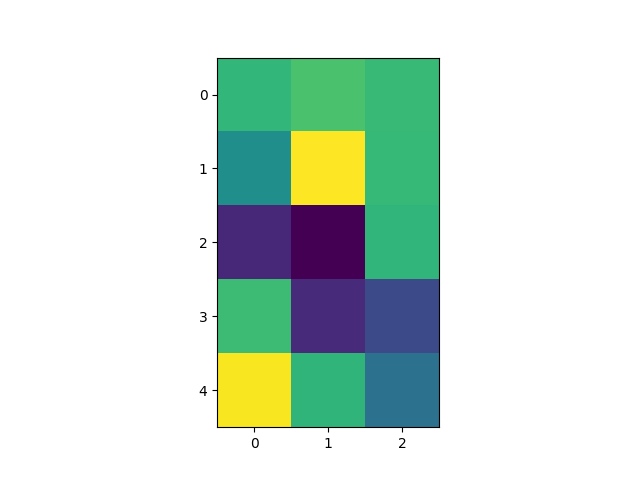
修改坐标格式设置工具
修改坐标格式设置工具以报告给定x和y的最近像素的图像“z”值。默认情况下,此功能是内置的,但显示如何自定义 format_coord 功能。
import numpy as np
import matplotlib.pyplot as plt

# Fixing random state for reproducibility
np.random.seed(19680801)


X = 10*np.random.rand(5, 3)

fig, ax = plt.subplots()
ax.imshow(X)

numrows, numcols = X.shape


def format_coord(x, y):
    col = int(x + 0.5)
    row = int(y + 0.5)
    if 0 <= col < numcols and 0 <= row < numrows:
        z = X[row, col]
        return 'x=%1.4f, y=%1.4f, z=%1.4f' % (x, y, z)
    else:
        return 'x=%1.4f, y=%1.4f' % (x, y)

ax.format_coord = format_coord
plt.show()
工具书类
以下函数、方法、类和模块的使用如本例所示:
import matplotlib
matplotlib.axes.Axes.format_coord
matplotlib.axes.Axes.imshow
出:
<function Axes.imshow at 0x7faa00dc7488>
关键词:matplotlib代码示例,codex,python plot,pyplot Gallery generated by Sphinx-Gallery