注解
Click here 下载完整的示例代码
修复常见的约会烦恼
Matplotlib允许您本机绘制python日期时间实例,并且在大多数情况下,它可以很好地选择刻度位置和字符串格式。有一些事情它处理得不那么优雅,这里有一些技巧来帮助你解决它们。我们将在numpy记录数组中加载一些包含datetime.date对象的示例日期数据:
In [63]: datafile = cbook.get_sample_data('goog.npz')

In [64]: r = np.load(datafile)['price_data'].view(np.recarray)

In [65]: r.dtype
Out[65]: dtype([('date', '<M8[D]'), ('', '|V4'), ('open', '<f8'),
                ('high', '<f8'), ('low', '<f8'), ('close', '<f8'),
                ('volume', '<i8'),  ('adj_close', '<f8')])

In [66]: r.date
Out[66]:
array(['2004-08-19', '2004-08-20', '2004-08-23', ..., '2008-10-10',
       '2008-10-13', '2008-10-14'], dtype='datetime64[D]')
字段的numpy记录数组的数据类型 date 是 datetime64[D] 这意味着它是64位的 numpy.datetime64 以“日”为单位。
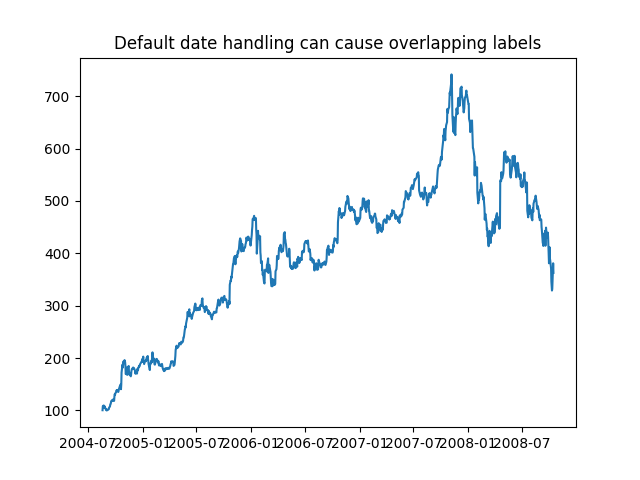
如果绘制数据,::
您将看到X记号标签都被压扁在一起。
import matplotlib.cbook as cbook
import matplotlib.dates as mdates
import numpy as np
import matplotlib.pyplot as plt

r = (cbook.get_sample_data('goog.npz', np_load=True)['price_data']
     .view(np.recarray))

fig, ax = plt.subplots()
ax.plot(r.date, r.close)
ax.set_title('Default date handling can cause overlapping labels')
出:
Text(0.5, 1.0, 'Default date handling can cause overlapping labels')
另一个麻烦是,如果将鼠标悬停在窗口上,然后查看Matplotlib工具栏的右下角 (默认用户界面 )在x和y坐标处,您可以看到x位置的格式与记号标签的格式相同,例如“2004年12月”。
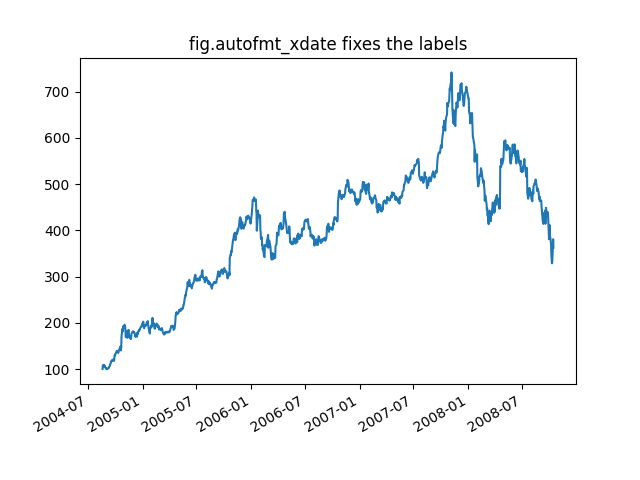
我们希望工具栏中的位置具有更高的精度,例如,为我们提供鼠标悬停的确切日期。为了解决第一个问题,我们可以使用 Figure.autofmt_xdate 为了解决第二个问题,我们可以使用 ax.fmt_xdata 属性,可以设置为任何接受标量并返回字符串的函数。Matplotlib内置了许多日期格式化程序,因此我们将使用其中的一个。
fig, ax = plt.subplots()
ax.plot(r.date, r.close)
# Rotate and align the tick labels so they look better.
fig.autofmt_xdate()
# Use a more precise date string for the x axis locations in the toolbar.
ax.fmt_xdata = mdates.DateFormatter('%Y-%m-%d')
ax.set_title('fig.autofmt_xdate fixes the labels')
出:
Text(0.5, 1.0, 'fig.autofmt_xdate fixes the labels')
现在,当您将鼠标悬停在绘制的数据上时,您将在工具栏中看到日期格式字符串,如2004-12-01。
plt.show()
关键词:matplotlib代码示例,codex,python plot,pyplot Gallery generated by Sphinx-Gallery