注解
Click here 下载完整的示例代码
箱形图演示
箱线图代码示例
import numpy as np
import matplotlib.pyplot as plt

# Fixing random state for reproducibility
np.random.seed(19680801)

# fake up some data
spread = np.random.rand(50) * 100
center = np.ones(25) * 50
flier_high = np.random.rand(10) * 100 + 100
flier_low = np.random.rand(10) * -100
data = np.concatenate((spread, center, flier_high, flier_low))
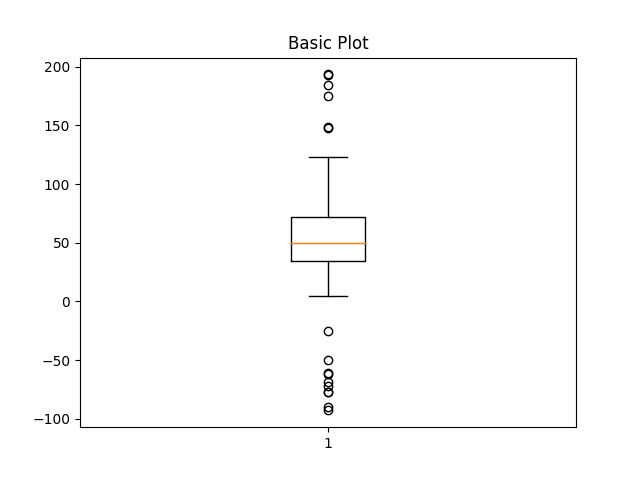
fig1, ax1 = plt.subplots()
ax1.set_title('Basic Plot')
ax1.boxplot(data)
出:
{'whiskers': [<matplotlib.lines.Line2D object at 0x7faa0d04e358>, <matplotlib.lines.Line2D object at 0x7faa0d04eef0>], 'caps': [<matplotlib.lines.Line2D object at 0x7faa0d04eeb8>, <matplotlib.lines.Line2D object at 0x7faa0d04e668>], 'boxes': [<matplotlib.lines.Line2D object at 0x7faa0d04ea20>], 'medians': [<matplotlib.lines.Line2D object at 0x7faa0a8b70f0>], 'fliers': [<matplotlib.lines.Line2D object at 0x7faa0a8b7630>], 'means': []}
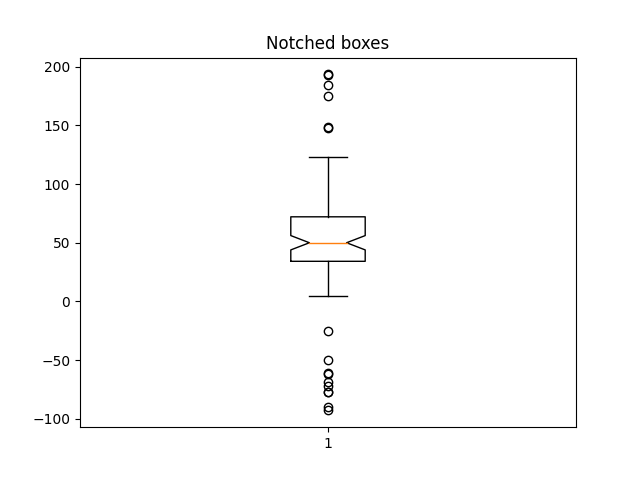
fig2, ax2 = plt.subplots()
ax2.set_title('Notched boxes')
ax2.boxplot(data, notch=True)
出:
{'whiskers': [<matplotlib.lines.Line2D object at 0x7fa9fc944f60>, <matplotlib.lines.Line2D object at 0x7fa9fc9444a8>], 'caps': [<matplotlib.lines.Line2D object at 0x7fa9fc944518>, <matplotlib.lines.Line2D object at 0x7fa9fc9446a0>], 'boxes': [<matplotlib.lines.Line2D object at 0x7fa9fc944470>], 'medians': [<matplotlib.lines.Line2D object at 0x7fa9fc944748>], 'fliers': [<matplotlib.lines.Line2D object at 0x7faa0a84a278>], 'means': []}
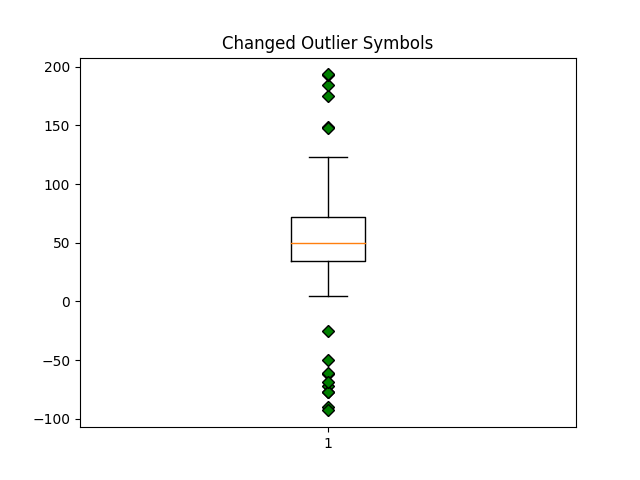
green_diamond = dict(markerfacecolor='g', marker='D')
fig3, ax3 = plt.subplots()
ax3.set_title('Changed Outlier Symbols')
ax3.boxplot(data, flierprops=green_diamond)
出:
{'whiskers': [<matplotlib.lines.Line2D object at 0x7faa0a932630>, <matplotlib.lines.Line2D object at 0x7faa0a932b00>], 'caps': [<matplotlib.lines.Line2D object at 0x7faa0a932ac8>, <matplotlib.lines.Line2D object at 0x7faa0a9324a8>], 'boxes': [<matplotlib.lines.Line2D object at 0x7faa0a9324e0>], 'medians': [<matplotlib.lines.Line2D object at 0x7faa0a932c18>], 'fliers': [<matplotlib.lines.Line2D object at 0x7faa0a9325c0>], 'means': []}
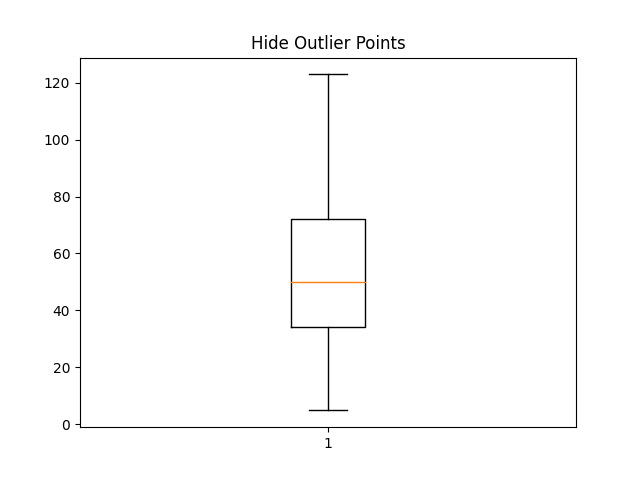
fig4, ax4 = plt.subplots()
ax4.set_title('Hide Outlier Points')
ax4.boxplot(data, showfliers=False)
出:
{'whiskers': [<matplotlib.lines.Line2D object at 0x7fa9c0375748>, <matplotlib.lines.Line2D object at 0x7fa9c03758d0>], 'caps': [<matplotlib.lines.Line2D object at 0x7faa0cb5a860>, <matplotlib.lines.Line2D object at 0x7fa9e4803c88>], 'boxes': [<matplotlib.lines.Line2D object at 0x7fa9c0375dd8>], 'medians': [<matplotlib.lines.Line2D object at 0x7fa9e4803358>], 'fliers': [], 'means': []}
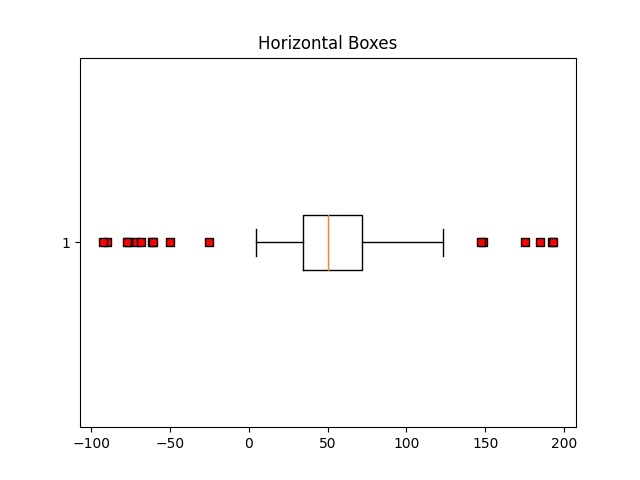
red_square = dict(markerfacecolor='r', marker='s')
fig5, ax5 = plt.subplots()
ax5.set_title('Horizontal Boxes')
ax5.boxplot(data, vert=False, flierprops=red_square)
出:
{'whiskers': [<matplotlib.lines.Line2D object at 0x7fa9fc93c470>, <matplotlib.lines.Line2D object at 0x7fa9fc93c278>], 'caps': [<matplotlib.lines.Line2D object at 0x7fa9fc964048>, <matplotlib.lines.Line2D object at 0x7fa9fc964320>], 'boxes': [<matplotlib.lines.Line2D object at 0x7fa9fc93c5f8>], 'medians': [<matplotlib.lines.Line2D object at 0x7fa9fc9645f8>], 'fliers': [<matplotlib.lines.Line2D object at 0x7fa9fc9648d0>], 'means': []}
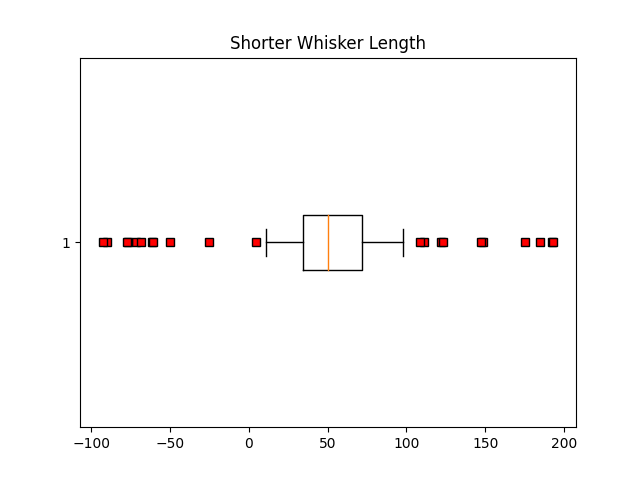
fig6, ax6 = plt.subplots()
ax6.set_title('Shorter Whisker Length')
ax6.boxplot(data, flierprops=red_square, vert=False, whis=0.75)
出:
{'whiskers': [<matplotlib.lines.Line2D object at 0x7faa0a8b5710>, <matplotlib.lines.Line2D object at 0x7faa0a8b59e8>], 'caps': [<matplotlib.lines.Line2D object at 0x7faa0a8b5cc0>, <matplotlib.lines.Line2D object at 0x7faa0a8b5f98>], 'boxes': [<matplotlib.lines.Line2D object at 0x7faa0a8b5668>], 'medians': [<matplotlib.lines.Line2D object at 0x7fa9c02d32b0>], 'fliers': [<matplotlib.lines.Line2D object at 0x7fa9c02d3588>], 'means': []}
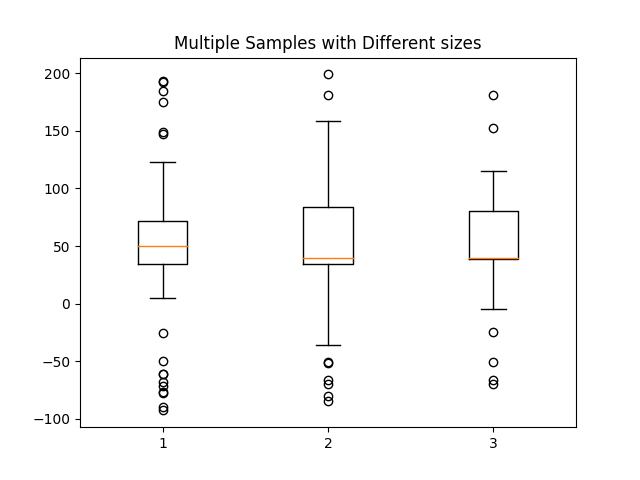
伪造更多的数据
spread = np.random.rand(50) * 100
center = np.ones(25) * 40
flier_high = np.random.rand(10) * 100 + 100
flier_low = np.random.rand(10) * -100
d2 = np.concatenate((spread, center, flier_high, flier_low))
只有当所有列的长度相同时,才能制作二维数组。如果不是,则使用列表。这实际上更有效,因为BoxPlot无论如何都会在内部将二维数组转换为向量列表。
data = [data, d2, d2[::2]]
fig7, ax7 = plt.subplots()
ax7.set_title('Multiple Samples with Different sizes')
ax7.boxplot(data)

plt.show()
工具书类
以下函数、方法、类和模块的使用如本例所示:
import matplotlib
matplotlib.axes.Axes.boxplot
matplotlib.pyplot.boxplot
出:
<function boxplot at 0x7faa00cfa048>
脚本的总运行时间: (0分1.854秒)
关键词:matplotlib代码示例,codex,python plot,pyplot Gallery generated by Sphinx-Gallery